Immigrants from Eastern Asia vs Mongolian Poverty
COMPARE
Immigrants from Eastern Asia
Mongolian
Poverty
Poverty Comparison
Immigrants from Eastern Asia
Mongolians
11.3%
POVERTY
96.7/ 100
METRIC RATING
77th/ 347
METRIC RANK
12.4%
POVERTY
43.6/ 100
METRIC RATING
180th/ 347
METRIC RANK
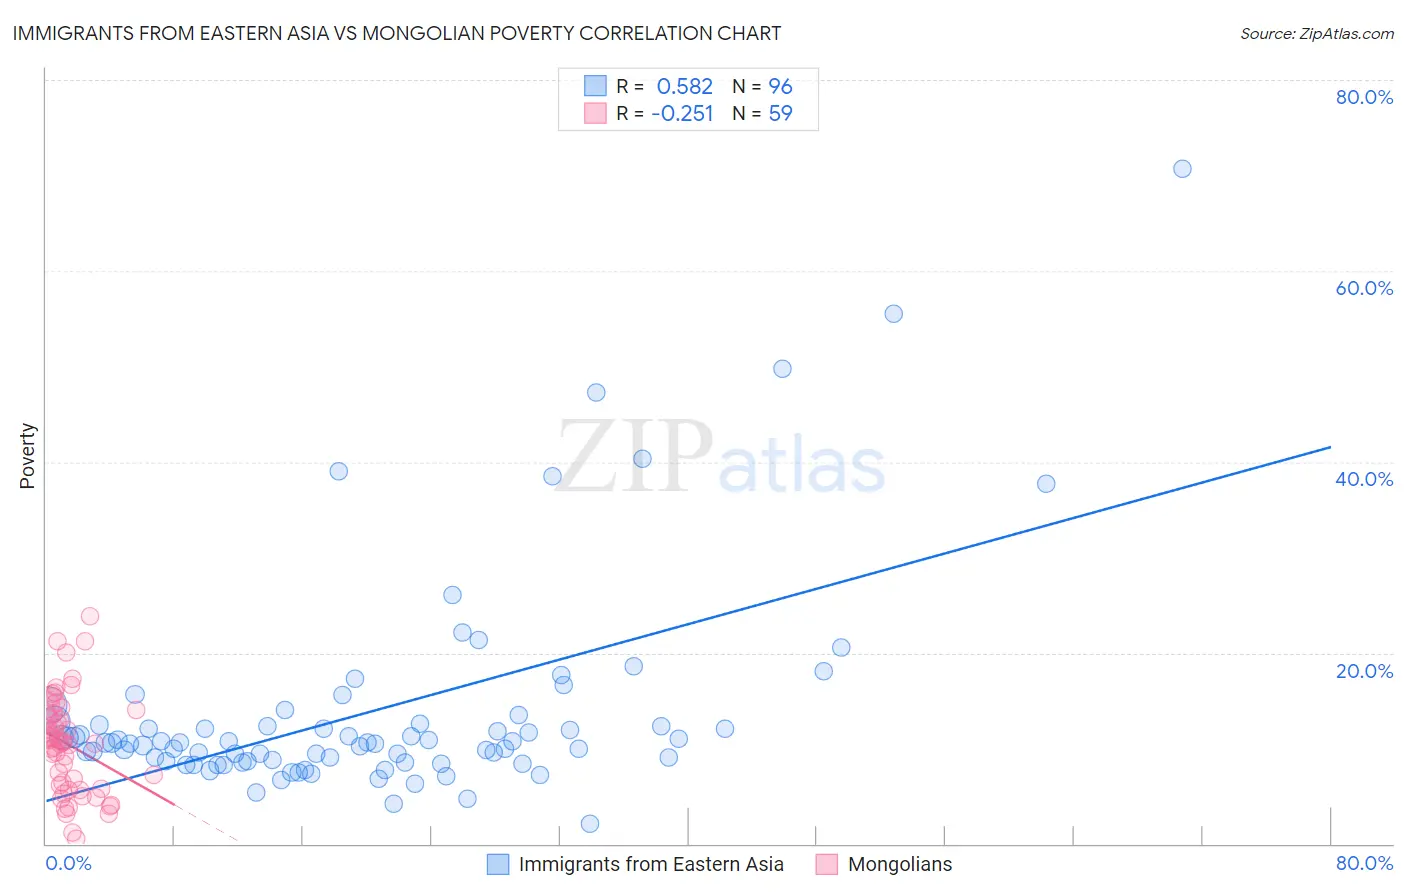
Immigrants from Eastern Asia vs Mongolian Poverty Correlation Chart
The statistical analysis conducted on geographies consisting of 499,367,398 people shows a substantial positive correlation between the proportion of Immigrants from Eastern Asia and poverty level in the United States with a correlation coefficient (R) of 0.582 and weighted average of 11.3%. Similarly, the statistical analysis conducted on geographies consisting of 140,290,240 people shows a weak negative correlation between the proportion of Mongolians and poverty level in the United States with a correlation coefficient (R) of -0.251 and weighted average of 12.4%, a difference of 9.6%.
Poverty Correlation Summary
| Measurement | Immigrants from Eastern Asia | Mongolian |
| Minimum | 2.1% | 0.57% |
| Maximum | 70.7% | 23.9% |
| Range | 68.7% | 23.3% |
| Mean | 13.9% | 10.4% |
| Median | 10.6% | 10.6% |
| Interquartile 25% (IQ1) | 8.6% | 5.7% |
| Interquartile 75% (IQ3) | 12.5% | 13.6% |
| Interquartile Range (IQR) | 3.8% | 7.9% |
| Standard Deviation (Sample) | 11.2% | 5.2% |
| Standard Deviation (Population) | 11.2% | 5.1% |
Similar Demographics by Poverty
Demographics Similar to Immigrants from Eastern Asia by Poverty
In terms of poverty, the demographic groups most similar to Immigrants from Eastern Asia are Dutch (11.3%, a difference of 0.010%), Cambodian (11.3%, a difference of 0.060%), Immigrants from North America (11.3%, a difference of 0.070%), Indian (Asian) (11.3%, a difference of 0.080%), and Irish (11.3%, a difference of 0.080%).
| Demographics | Rating | Rank | Poverty |
| Immigrants | Canada | 97.3 /100 | #70 | Exceptional 11.3% |
| Zimbabweans | 97.3 /100 | #71 | Exceptional 11.3% |
| Europeans | 97.2 /100 | #72 | Exceptional 11.3% |
| Immigrants | Belgium | 97.2 /100 | #73 | Exceptional 11.3% |
| Carpatho Rusyns | 97.2 /100 | #74 | Exceptional 11.3% |
| Immigrants | Eastern Europe | 97.0 /100 | #75 | Exceptional 11.3% |
| Immigrants | North America | 96.8 /100 | #76 | Exceptional 11.3% |
| Immigrants | Eastern Asia | 96.7 /100 | #77 | Exceptional 11.3% |
| Dutch | 96.7 /100 | #78 | Exceptional 11.3% |
| Cambodians | 96.7 /100 | #79 | Exceptional 11.3% |
| Indians (Asian) | 96.6 /100 | #80 | Exceptional 11.3% |
| Irish | 96.6 /100 | #81 | Exceptional 11.3% |
| Egyptians | 96.5 /100 | #82 | Exceptional 11.3% |
| Immigrants | Sweden | 96.3 /100 | #83 | Exceptional 11.3% |
| English | 96.3 /100 | #84 | Exceptional 11.3% |
Demographics Similar to Mongolians by Poverty
In terms of poverty, the demographic groups most similar to Mongolians are Immigrants from Morocco (12.4%, a difference of 0.040%), Uruguayan (12.4%, a difference of 0.10%), Immigrants from Afghanistan (12.4%, a difference of 0.15%), Immigrants from Cameroon (12.4%, a difference of 0.19%), and Immigrants from Iraq (12.4%, a difference of 0.34%).
| Demographics | Rating | Rank | Poverty |
| Celtics | 50.1 /100 | #173 | Average 12.3% |
| Lebanese | 50.0 /100 | #174 | Average 12.3% |
| South Americans | 48.7 /100 | #175 | Average 12.3% |
| Immigrants | Colombia | 47.7 /100 | #176 | Average 12.3% |
| Immigrants | Syria | 47.5 /100 | #177 | Average 12.3% |
| Uruguayans | 44.7 /100 | #178 | Average 12.4% |
| Immigrants | Morocco | 44.0 /100 | #179 | Average 12.4% |
| Mongolians | 43.6 /100 | #180 | Average 12.4% |
| Immigrants | Afghanistan | 42.1 /100 | #181 | Average 12.4% |
| Immigrants | Cameroon | 41.7 /100 | #182 | Average 12.4% |
| Immigrants | Iraq | 40.2 /100 | #183 | Average 12.4% |
| Kenyans | 38.8 /100 | #184 | Fair 12.5% |
| Israelis | 36.4 /100 | #185 | Fair 12.5% |
| Immigrants | Sierra Leone | 36.3 /100 | #186 | Fair 12.5% |
| Hawaiians | 34.1 /100 | #187 | Fair 12.5% |