Tohono O'odham vs Immigrants from Denmark 11th Grade
COMPARE
Tohono O'odham
Immigrants from Denmark
11th Grade
11th Grade Comparison
Tohono O'odham
Immigrants from Denmark
87.6%
11TH GRADE
0.0/ 100
METRIC RATING
328th/ 347
METRIC RANK
93.7%
11TH GRADE
99.5/ 100
METRIC RATING
79th/ 347
METRIC RANK
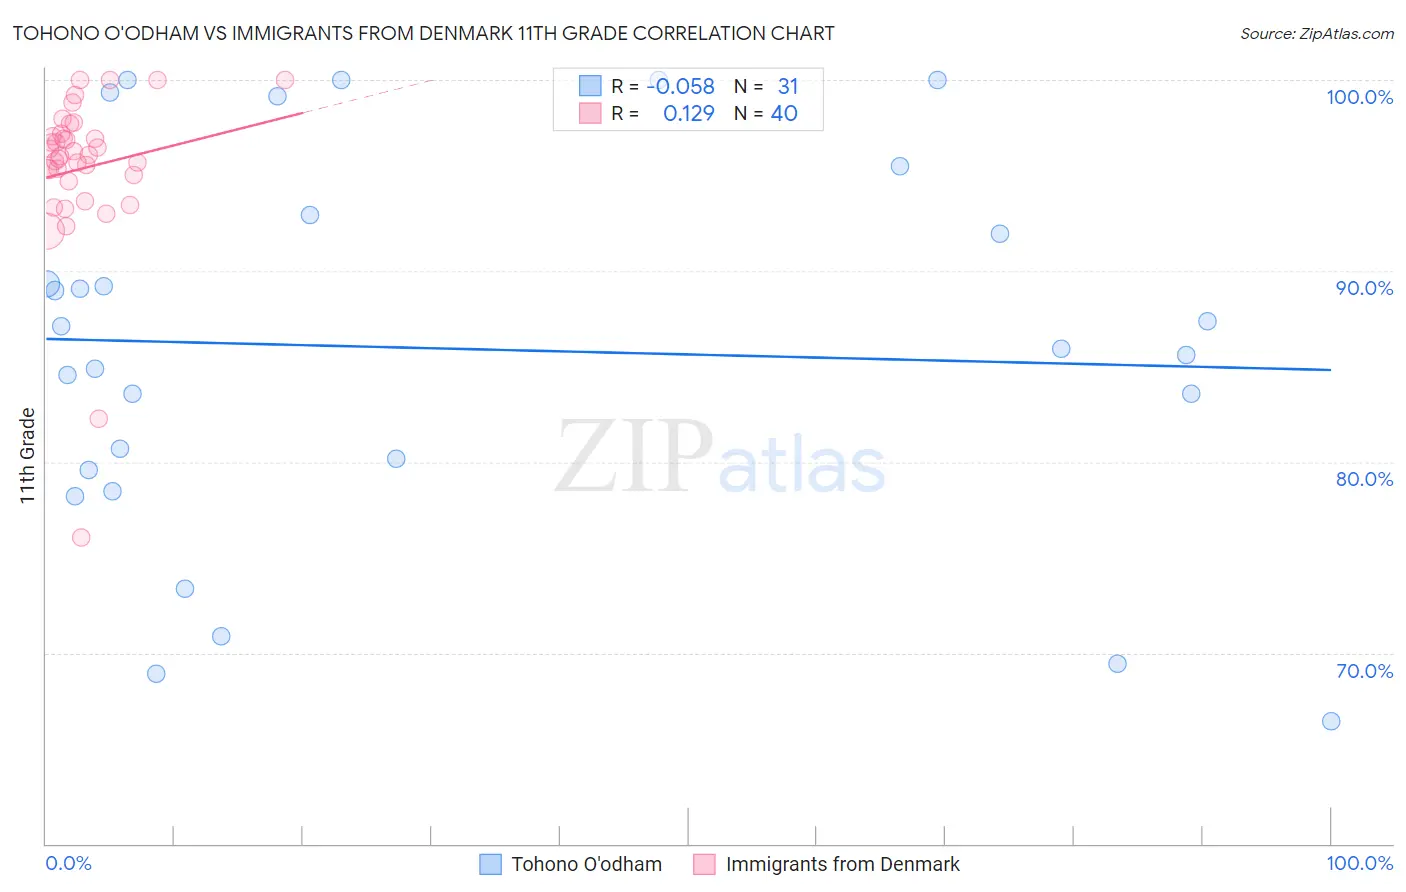
Tohono O'odham vs Immigrants from Denmark 11th Grade Correlation Chart
The statistical analysis conducted on geographies consisting of 58,730,615 people shows a slight negative correlation between the proportion of Tohono O'odham and percentage of population with at least 11th grade education in the United States with a correlation coefficient (R) of -0.058 and weighted average of 87.6%. Similarly, the statistical analysis conducted on geographies consisting of 136,430,715 people shows a poor positive correlation between the proportion of Immigrants from Denmark and percentage of population with at least 11th grade education in the United States with a correlation coefficient (R) of 0.129 and weighted average of 93.7%, a difference of 7.0%.
11th Grade Correlation Summary
| Measurement | Tohono O'odham | Immigrants from Denmark |
| Minimum | 66.4% | 76.1% |
| Maximum | 100.0% | 100.0% |
| Range | 33.6% | 23.9% |
| Mean | 85.9% | 95.4% |
| Median | 86.0% | 96.0% |
| Interquartile 25% (IQ1) | 79.6% | 94.8% |
| Interquartile 75% (IQ3) | 93.0% | 97.1% |
| Interquartile Range (IQR) | 13.4% | 2.3% |
| Standard Deviation (Sample) | 9.9% | 4.4% |
| Standard Deviation (Population) | 9.7% | 4.3% |
Similar Demographics by 11th Grade
Demographics Similar to Tohono O'odham by 11th Grade
In terms of 11th grade, the demographic groups most similar to Tohono O'odham are Immigrants from Cabo Verde (87.6%, a difference of 0.060%), Mexican American Indian (87.5%, a difference of 0.070%), Dominican (87.7%, a difference of 0.080%), Honduran (87.4%, a difference of 0.26%), and Hispanic or Latino (87.3%, a difference of 0.32%).
| Demographics | Rating | Rank | 11th Grade |
| Immigrants | Belize | 0.0 /100 | #321 | Tragic 88.7% |
| Puerto Ricans | 0.0 /100 | #322 | Tragic 88.4% |
| Pima | 0.0 /100 | #323 | Tragic 88.3% |
| Central American Indians | 0.0 /100 | #324 | Tragic 88.2% |
| Immigrants | Nicaragua | 0.0 /100 | #325 | Tragic 88.1% |
| Dominicans | 0.0 /100 | #326 | Tragic 87.7% |
| Immigrants | Cabo Verde | 0.0 /100 | #327 | Tragic 87.6% |
| Tohono O'odham | 0.0 /100 | #328 | Tragic 87.6% |
| Mexican American Indians | 0.0 /100 | #329 | Tragic 87.5% |
| Hondurans | 0.0 /100 | #330 | Tragic 87.4% |
| Hispanics or Latinos | 0.0 /100 | #331 | Tragic 87.3% |
| Immigrants | Azores | 0.0 /100 | #332 | Tragic 87.2% |
| Immigrants | Yemen | 0.0 /100 | #333 | Tragic 87.1% |
| Houma | 0.0 /100 | #334 | Tragic 87.0% |
| Central Americans | 0.0 /100 | #335 | Tragic 86.9% |
Demographics Similar to Immigrants from Denmark by 11th Grade
In terms of 11th grade, the demographic groups most similar to Immigrants from Denmark are Celtic (93.7%, a difference of 0.010%), Aleut (93.7%, a difference of 0.010%), Soviet Union (93.7%, a difference of 0.010%), Canadian (93.7%, a difference of 0.020%), and Immigrants from Moldova (93.7%, a difference of 0.020%).
| Demographics | Rating | Rank | 11th Grade |
| Immigrants | Japan | 99.7 /100 | #72 | Exceptional 93.8% |
| Romanians | 99.6 /100 | #73 | Exceptional 93.8% |
| Immigrants | Czechoslovakia | 99.6 /100 | #74 | Exceptional 93.8% |
| Immigrants | Latvia | 99.6 /100 | #75 | Exceptional 93.8% |
| Celtics | 99.5 /100 | #76 | Exceptional 93.7% |
| Aleuts | 99.5 /100 | #77 | Exceptional 93.7% |
| Soviet Union | 99.5 /100 | #78 | Exceptional 93.7% |
| Immigrants | Denmark | 99.5 /100 | #79 | Exceptional 93.7% |
| Canadians | 99.5 /100 | #80 | Exceptional 93.7% |
| Immigrants | Moldova | 99.5 /100 | #81 | Exceptional 93.7% |
| Immigrants | Saudi Arabia | 99.3 /100 | #82 | Exceptional 93.7% |
| Icelanders | 99.3 /100 | #83 | Exceptional 93.6% |
| Immigrants | Taiwan | 99.3 /100 | #84 | Exceptional 93.6% |
| Immigrants | Switzerland | 99.3 /100 | #85 | Exceptional 93.6% |
| Immigrants | South Central Asia | 99.2 /100 | #86 | Exceptional 93.6% |