Immigrants from Guatemala vs Northern European Single Mother Poverty
COMPARE
Immigrants from Guatemala
Northern European
Single Mother Poverty
Single Mother Poverty Comparison
Immigrants from Guatemala
Northern Europeans
33.3%
SINGLE MOTHER POVERTY
0.0/ 100
METRIC RATING
299th/ 347
METRIC RANK
28.6%
SINGLE MOTHER POVERTY
81.7/ 100
METRIC RATING
150th/ 347
METRIC RANK
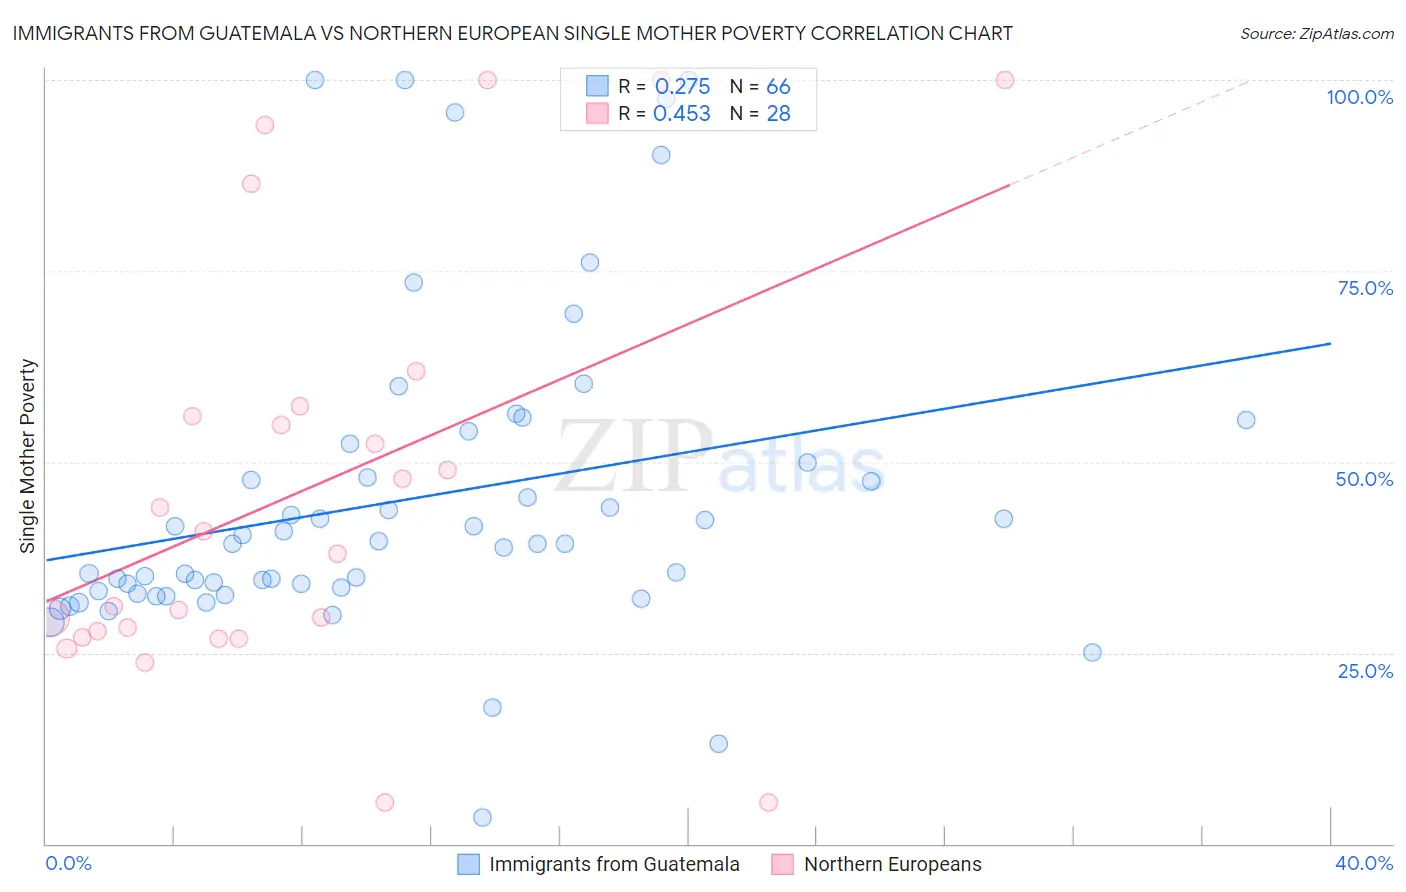
Immigrants from Guatemala vs Northern European Single Mother Poverty Correlation Chart
The statistical analysis conducted on geographies consisting of 371,171,029 people shows a weak positive correlation between the proportion of Immigrants from Guatemala and poverty level among single mothers in the United States with a correlation coefficient (R) of 0.275 and weighted average of 33.3%. Similarly, the statistical analysis conducted on geographies consisting of 394,065,574 people shows a moderate positive correlation between the proportion of Northern Europeans and poverty level among single mothers in the United States with a correlation coefficient (R) of 0.453 and weighted average of 28.6%, a difference of 16.3%.
Single Mother Poverty Correlation Summary
| Measurement | Immigrants from Guatemala | Northern European |
| Minimum | 3.4% | 5.4% |
| Maximum | 100.0% | 100.0% |
| Range | 96.6% | 94.6% |
| Mean | 45.0% | 46.4% |
| Median | 39.3% | 39.4% |
| Interquartile 25% (IQ1) | 33.0% | 27.4% |
| Interquartile 75% (IQ3) | 50.0% | 56.6% |
| Interquartile Range (IQR) | 17.0% | 29.2% |
| Standard Deviation (Sample) | 20.7% | 27.4% |
| Standard Deviation (Population) | 20.5% | 26.9% |
Similar Demographics by Single Mother Poverty
Demographics Similar to Immigrants from Guatemala by Single Mother Poverty
In terms of single mother poverty, the demographic groups most similar to Immigrants from Guatemala are Hispanic or Latino (33.3%, a difference of 0.0%), African (33.3%, a difference of 0.090%), Pennsylvania German (33.2%, a difference of 0.20%), Immigrants from Somalia (33.4%, a difference of 0.25%), and Blackfeet (33.2%, a difference of 0.34%).
| Demographics | Rating | Rank | Single Mother Poverty |
| Shoshone | 0.0 /100 | #292 | Tragic 32.9% |
| Aleuts | 0.0 /100 | #293 | Tragic 32.9% |
| French American Indians | 0.0 /100 | #294 | Tragic 33.1% |
| Yaqui | 0.0 /100 | #295 | Tragic 33.1% |
| Blackfeet | 0.0 /100 | #296 | Tragic 33.2% |
| Pennsylvania Germans | 0.0 /100 | #297 | Tragic 33.2% |
| Africans | 0.0 /100 | #298 | Tragic 33.3% |
| Immigrants | Guatemala | 0.0 /100 | #299 | Tragic 33.3% |
| Hispanics or Latinos | 0.0 /100 | #300 | Tragic 33.3% |
| Immigrants | Somalia | 0.0 /100 | #301 | Tragic 33.4% |
| Arapaho | 0.0 /100 | #302 | Tragic 33.4% |
| Americans | 0.0 /100 | #303 | Tragic 33.5% |
| Mexicans | 0.0 /100 | #304 | Tragic 33.6% |
| Immigrants | Central America | 0.0 /100 | #305 | Tragic 33.6% |
| Immigrants | Congo | 0.0 /100 | #306 | Tragic 33.8% |
Demographics Similar to Northern Europeans by Single Mother Poverty
In terms of single mother poverty, the demographic groups most similar to Northern Europeans are Immigrants from Oceania (28.7%, a difference of 0.14%), Austrian (28.7%, a difference of 0.21%), Serbian (28.6%, a difference of 0.30%), Syrian (28.6%, a difference of 0.32%), and Immigrants from Lebanon (28.6%, a difference of 0.33%).
| Demographics | Rating | Rank | Single Mother Poverty |
| Immigrants | North America | 86.5 /100 | #143 | Excellent 28.5% |
| Luxembourgers | 86.4 /100 | #144 | Excellent 28.5% |
| Immigrants | South America | 86.1 /100 | #145 | Excellent 28.5% |
| Immigrants | Denmark | 86.1 /100 | #146 | Excellent 28.5% |
| Immigrants | Lebanon | 85.3 /100 | #147 | Excellent 28.6% |
| Syrians | 85.3 /100 | #148 | Excellent 28.6% |
| Serbians | 85.0 /100 | #149 | Excellent 28.6% |
| Northern Europeans | 81.7 /100 | #150 | Excellent 28.6% |
| Immigrants | Oceania | 79.9 /100 | #151 | Good 28.7% |
| Austrians | 79.0 /100 | #152 | Good 28.7% |
| Slovenes | 76.4 /100 | #153 | Good 28.8% |
| Portuguese | 73.2 /100 | #154 | Good 28.8% |
| Ugandans | 71.7 /100 | #155 | Good 28.8% |
| Iraqis | 71.5 /100 | #156 | Good 28.8% |
| Immigrants | Western Europe | 71.1 /100 | #157 | Good 28.9% |