Malaysian vs Northern European Single Mother Poverty
COMPARE
Malaysian
Northern European
Single Mother Poverty
Single Mother Poverty Comparison
Malaysians
Northern Europeans
29.7%
SINGLE MOTHER POVERTY
17.4/ 100
METRIC RATING
202nd/ 347
METRIC RANK
28.6%
SINGLE MOTHER POVERTY
81.7/ 100
METRIC RATING
150th/ 347
METRIC RANK
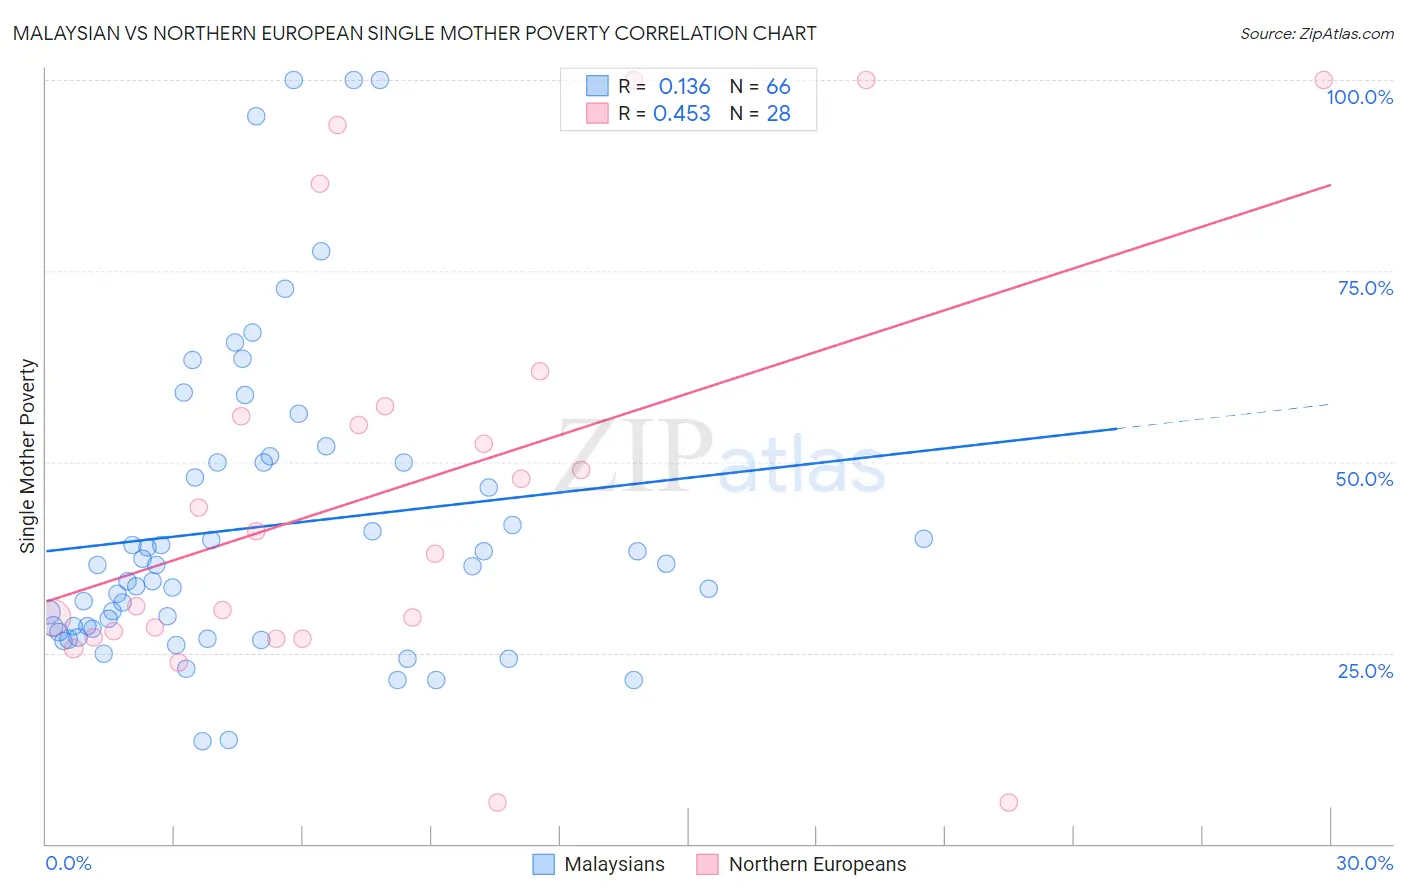
Malaysian vs Northern European Single Mother Poverty Correlation Chart
The statistical analysis conducted on geographies consisting of 223,567,938 people shows a poor positive correlation between the proportion of Malaysians and poverty level among single mothers in the United States with a correlation coefficient (R) of 0.136 and weighted average of 29.7%. Similarly, the statistical analysis conducted on geographies consisting of 394,065,574 people shows a moderate positive correlation between the proportion of Northern Europeans and poverty level among single mothers in the United States with a correlation coefficient (R) of 0.453 and weighted average of 28.6%, a difference of 3.7%.
Single Mother Poverty Correlation Summary
| Measurement | Malaysian | Northern European |
| Minimum | 13.4% | 5.4% |
| Maximum | 100.0% | 100.0% |
| Range | 86.6% | 94.6% |
| Mean | 41.5% | 46.4% |
| Median | 36.4% | 39.4% |
| Interquartile 25% (IQ1) | 28.2% | 27.4% |
| Interquartile 75% (IQ3) | 50.0% | 56.6% |
| Interquartile Range (IQR) | 21.8% | 29.2% |
| Standard Deviation (Sample) | 20.1% | 27.4% |
| Standard Deviation (Population) | 20.0% | 26.9% |
Similar Demographics by Single Mother Poverty
Demographics Similar to Malaysians by Single Mother Poverty
In terms of single mother poverty, the demographic groups most similar to Malaysians are Swiss (29.7%, a difference of 0.020%), Immigrants (29.7%, a difference of 0.070%), Belgian (29.7%, a difference of 0.10%), Czechoslovakian (29.7%, a difference of 0.11%), and Immigrants from Haiti (29.7%, a difference of 0.14%).
| Demographics | Rating | Rank | Single Mother Poverty |
| Slavs | 24.5 /100 | #195 | Fair 29.6% |
| Spanish American Indians | 23.4 /100 | #196 | Fair 29.6% |
| Immigrants | Jamaica | 22.0 /100 | #197 | Fair 29.6% |
| Trinidadians and Tobagonians | 21.7 /100 | #198 | Fair 29.6% |
| Cubans | 20.8 /100 | #199 | Fair 29.6% |
| Panamanians | 20.0 /100 | #200 | Fair 29.6% |
| Belgians | 18.8 /100 | #201 | Poor 29.7% |
| Malaysians | 17.4 /100 | #202 | Poor 29.7% |
| Swiss | 17.2 /100 | #203 | Poor 29.7% |
| Immigrants | Immigrants | 16.6 /100 | #204 | Poor 29.7% |
| Czechoslovakians | 16.1 /100 | #205 | Poor 29.7% |
| Immigrants | Haiti | 15.8 /100 | #206 | Poor 29.7% |
| Immigrants | Panama | 15.5 /100 | #207 | Poor 29.8% |
| Immigrants | Guyana | 14.7 /100 | #208 | Poor 29.8% |
| Irish | 13.9 /100 | #209 | Poor 29.8% |
Demographics Similar to Northern Europeans by Single Mother Poverty
In terms of single mother poverty, the demographic groups most similar to Northern Europeans are Immigrants from Oceania (28.7%, a difference of 0.14%), Austrian (28.7%, a difference of 0.21%), Serbian (28.6%, a difference of 0.30%), Syrian (28.6%, a difference of 0.32%), and Immigrants from Lebanon (28.6%, a difference of 0.33%).
| Demographics | Rating | Rank | Single Mother Poverty |
| Immigrants | North America | 86.5 /100 | #143 | Excellent 28.5% |
| Luxembourgers | 86.4 /100 | #144 | Excellent 28.5% |
| Immigrants | South America | 86.1 /100 | #145 | Excellent 28.5% |
| Immigrants | Denmark | 86.1 /100 | #146 | Excellent 28.5% |
| Immigrants | Lebanon | 85.3 /100 | #147 | Excellent 28.6% |
| Syrians | 85.3 /100 | #148 | Excellent 28.6% |
| Serbians | 85.0 /100 | #149 | Excellent 28.6% |
| Northern Europeans | 81.7 /100 | #150 | Excellent 28.6% |
| Immigrants | Oceania | 79.9 /100 | #151 | Good 28.7% |
| Austrians | 79.0 /100 | #152 | Good 28.7% |
| Slovenes | 76.4 /100 | #153 | Good 28.8% |
| Portuguese | 73.2 /100 | #154 | Good 28.8% |
| Ugandans | 71.7 /100 | #155 | Good 28.8% |
| Iraqis | 71.5 /100 | #156 | Good 28.8% |
| Immigrants | Western Europe | 71.1 /100 | #157 | Good 28.9% |