South American Indian vs Northern European Single Mother Poverty
COMPARE
South American Indian
Northern European
Single Mother Poverty
Single Mother Poverty Comparison
South American Indians
Northern Europeans
29.3%
SINGLE MOTHER POVERTY
43.2/ 100
METRIC RATING
178th/ 347
METRIC RANK
28.6%
SINGLE MOTHER POVERTY
81.7/ 100
METRIC RATING
150th/ 347
METRIC RANK
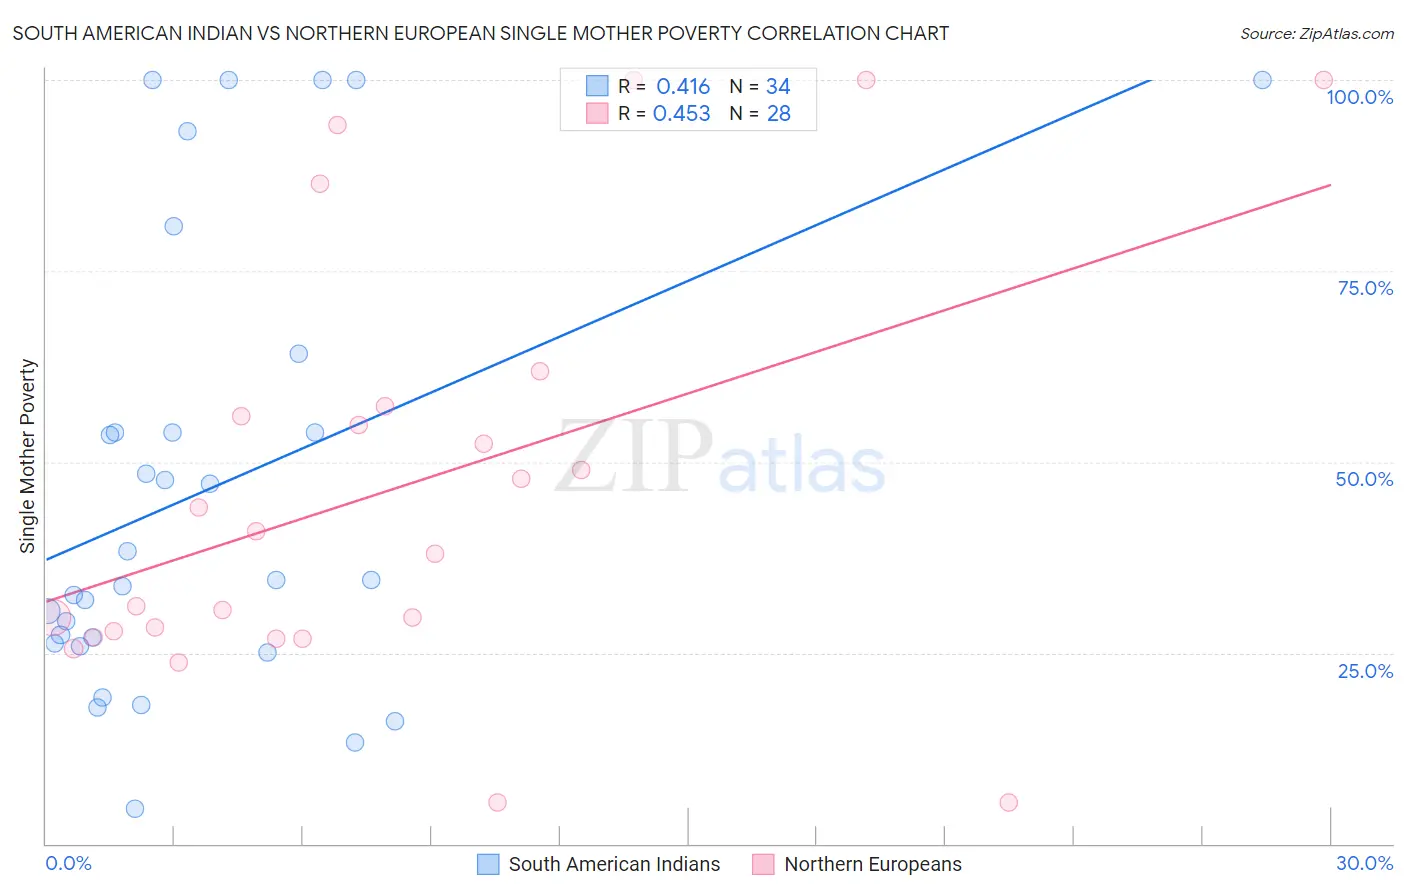
South American Indian vs Northern European Single Mother Poverty Correlation Chart
The statistical analysis conducted on geographies consisting of 163,070,605 people shows a moderate positive correlation between the proportion of South American Indians and poverty level among single mothers in the United States with a correlation coefficient (R) of 0.416 and weighted average of 29.3%. Similarly, the statistical analysis conducted on geographies consisting of 394,065,574 people shows a moderate positive correlation between the proportion of Northern Europeans and poverty level among single mothers in the United States with a correlation coefficient (R) of 0.453 and weighted average of 28.6%, a difference of 2.1%.
Single Mother Poverty Correlation Summary
| Measurement | South American Indian | Northern European |
| Minimum | 4.7% | 5.4% |
| Maximum | 100.0% | 100.0% |
| Range | 95.3% | 94.6% |
| Mean | 46.5% | 46.4% |
| Median | 34.5% | 39.4% |
| Interquartile 25% (IQ1) | 26.2% | 27.4% |
| Interquartile 75% (IQ3) | 53.9% | 56.6% |
| Interquartile Range (IQR) | 27.7% | 29.2% |
| Standard Deviation (Sample) | 29.1% | 27.4% |
| Standard Deviation (Population) | 28.6% | 26.9% |
Similar Demographics by Single Mother Poverty
Demographics Similar to South American Indians by Single Mother Poverty
In terms of single mother poverty, the demographic groups most similar to South American Indians are Immigrants from Uzbekistan (29.3%, a difference of 0.030%), Immigrants from Bosnia and Herzegovina (29.2%, a difference of 0.090%), Immigrants from Norway (29.3%, a difference of 0.090%), Canadian (29.3%, a difference of 0.14%), and Hawaiian (29.2%, a difference of 0.22%).
| Demographics | Rating | Rank | Single Mother Poverty |
| Puget Sound Salish | 55.1 /100 | #171 | Average 29.1% |
| Carpatho Rusyns | 53.8 /100 | #172 | Average 29.1% |
| British | 50.6 /100 | #173 | Average 29.2% |
| Immigrants | Saudi Arabia | 50.0 /100 | #174 | Average 29.2% |
| Immigrants | Costa Rica | 48.8 /100 | #175 | Average 29.2% |
| Hawaiians | 47.8 /100 | #176 | Average 29.2% |
| Immigrants | Bosnia and Herzegovina | 45.1 /100 | #177 | Average 29.2% |
| South American Indians | 43.2 /100 | #178 | Average 29.3% |
| Immigrants | Uzbekistan | 42.6 /100 | #179 | Average 29.3% |
| Immigrants | Norway | 41.5 /100 | #180 | Average 29.3% |
| Canadians | 40.4 /100 | #181 | Average 29.3% |
| Immigrants | Eastern Africa | 38.5 /100 | #182 | Fair 29.3% |
| Nepalese | 38.3 /100 | #183 | Fair 29.3% |
| Nigerians | 38.0 /100 | #184 | Fair 29.3% |
| Ghanaians | 36.8 /100 | #185 | Fair 29.4% |
Demographics Similar to Northern Europeans by Single Mother Poverty
In terms of single mother poverty, the demographic groups most similar to Northern Europeans are Immigrants from Oceania (28.7%, a difference of 0.14%), Austrian (28.7%, a difference of 0.21%), Serbian (28.6%, a difference of 0.30%), Syrian (28.6%, a difference of 0.32%), and Immigrants from Lebanon (28.6%, a difference of 0.33%).
| Demographics | Rating | Rank | Single Mother Poverty |
| Immigrants | North America | 86.5 /100 | #143 | Excellent 28.5% |
| Luxembourgers | 86.4 /100 | #144 | Excellent 28.5% |
| Immigrants | South America | 86.1 /100 | #145 | Excellent 28.5% |
| Immigrants | Denmark | 86.1 /100 | #146 | Excellent 28.5% |
| Immigrants | Lebanon | 85.3 /100 | #147 | Excellent 28.6% |
| Syrians | 85.3 /100 | #148 | Excellent 28.6% |
| Serbians | 85.0 /100 | #149 | Excellent 28.6% |
| Northern Europeans | 81.7 /100 | #150 | Excellent 28.6% |
| Immigrants | Oceania | 79.9 /100 | #151 | Good 28.7% |
| Austrians | 79.0 /100 | #152 | Good 28.7% |
| Slovenes | 76.4 /100 | #153 | Good 28.8% |
| Portuguese | 73.2 /100 | #154 | Good 28.8% |
| Ugandans | 71.7 /100 | #155 | Good 28.8% |
| Iraqis | 71.5 /100 | #156 | Good 28.8% |
| Immigrants | Western Europe | 71.1 /100 | #157 | Good 28.9% |