Vietnamese vs Immigrants from Poland Single Father Poverty
COMPARE
Vietnamese
Immigrants from Poland
Single Father Poverty
Single Father Poverty Comparison
Vietnamese
Immigrants from Poland
16.3%
SINGLE FATHER POVERTY
48.0/ 100
METRIC RATING
176th/ 347
METRIC RANK
15.7%
SINGLE FATHER POVERTY
95.8/ 100
METRIC RATING
106th/ 347
METRIC RANK
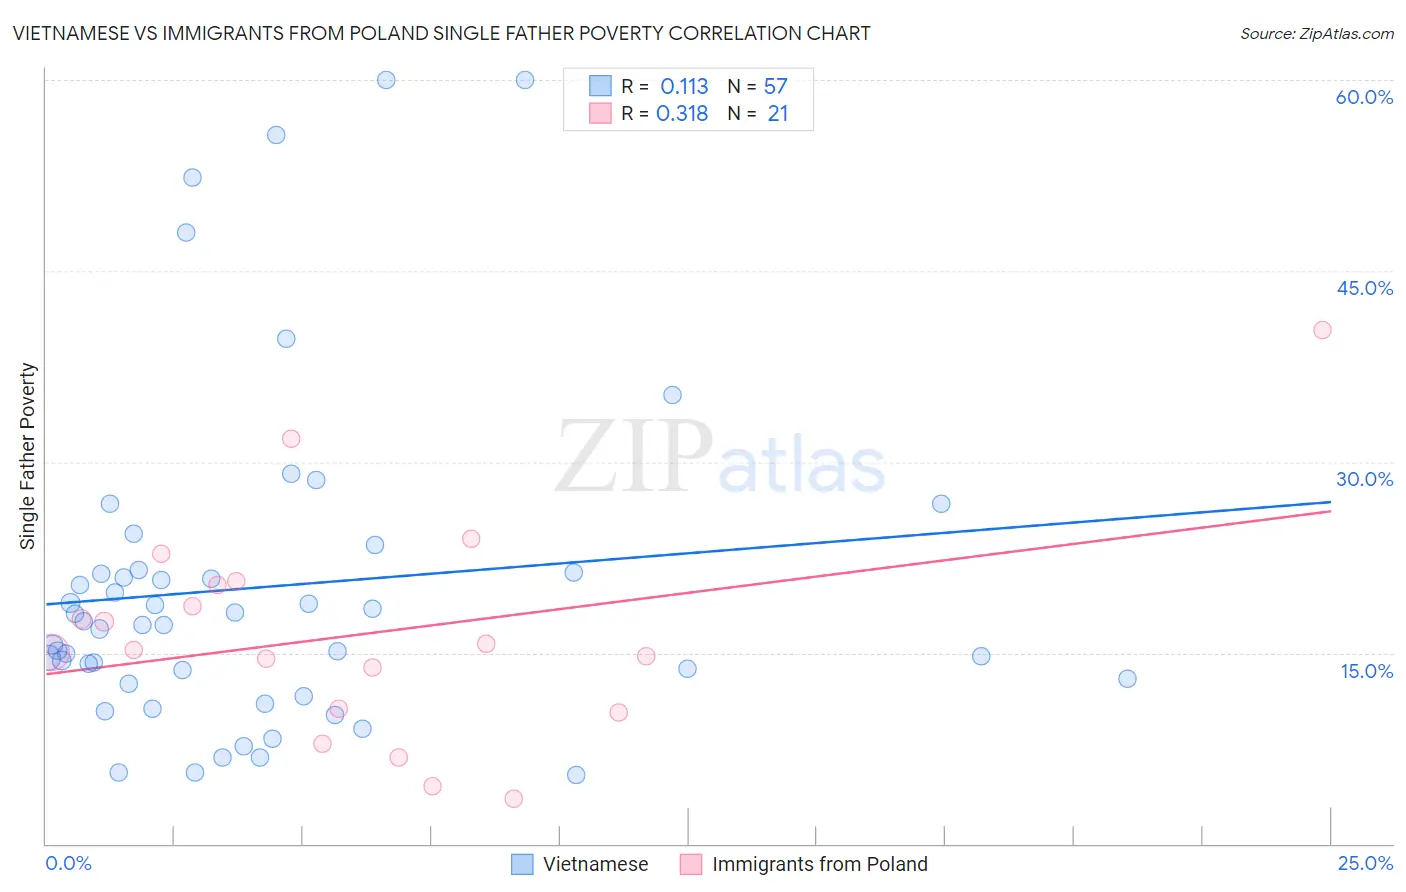
Vietnamese vs Immigrants from Poland Single Father Poverty Correlation Chart
The statistical analysis conducted on geographies consisting of 147,063,845 people shows a poor positive correlation between the proportion of Vietnamese and poverty level among single fathers in the United States with a correlation coefficient (R) of 0.113 and weighted average of 16.3%. Similarly, the statistical analysis conducted on geographies consisting of 239,246,300 people shows a mild positive correlation between the proportion of Immigrants from Poland and poverty level among single fathers in the United States with a correlation coefficient (R) of 0.318 and weighted average of 15.7%, a difference of 3.7%.
Single Father Poverty Correlation Summary
| Measurement | Vietnamese | Immigrants from Poland |
| Minimum | 5.4% | 3.5% |
| Maximum | 60.0% | 40.3% |
| Range | 54.6% | 36.8% |
| Mean | 20.2% | 16.5% |
| Median | 17.2% | 15.2% |
| Interquartile 25% (IQ1) | 12.7% | 10.5% |
| Interquartile 75% (IQ3) | 21.4% | 20.5% |
| Interquartile Range (IQR) | 8.6% | 10.0% |
| Standard Deviation (Sample) | 13.0% | 8.7% |
| Standard Deviation (Population) | 12.9% | 8.5% |
Similar Demographics by Single Father Poverty
Demographics Similar to Vietnamese by Single Father Poverty
In terms of single father poverty, the demographic groups most similar to Vietnamese are Immigrants from Ecuador (16.3%, a difference of 0.070%), Immigrants from Sierra Leone (16.3%, a difference of 0.090%), Immigrants from St. Vincent and the Grenadines (16.3%, a difference of 0.090%), Swedish (16.3%, a difference of 0.090%), and Immigrants from Morocco (16.3%, a difference of 0.12%).
| Demographics | Rating | Rank | Single Father Poverty |
| Northern Europeans | 52.8 /100 | #169 | Average 16.3% |
| Scandinavians | 52.3 /100 | #170 | Average 16.3% |
| Immigrants | Morocco | 50.7 /100 | #171 | Average 16.3% |
| Immigrants | Sierra Leone | 50.1 /100 | #172 | Average 16.3% |
| Immigrants | St. Vincent and the Grenadines | 50.0 /100 | #173 | Average 16.3% |
| Swedes | 50.0 /100 | #174 | Average 16.3% |
| Immigrants | Ecuador | 49.7 /100 | #175 | Average 16.3% |
| Vietnamese | 48.0 /100 | #176 | Average 16.3% |
| Immigrants | South Africa | 44.2 /100 | #177 | Average 16.3% |
| Immigrants | Cuba | 41.6 /100 | #178 | Average 16.4% |
| Serbians | 40.9 /100 | #179 | Average 16.4% |
| Immigrants | Latin America | 37.2 /100 | #180 | Fair 16.4% |
| Immigrants | Western Africa | 36.0 /100 | #181 | Fair 16.4% |
| Immigrants | Italy | 35.7 /100 | #182 | Fair 16.4% |
| Aleuts | 35.3 /100 | #183 | Fair 16.4% |
Demographics Similar to Immigrants from Poland by Single Father Poverty
In terms of single father poverty, the demographic groups most similar to Immigrants from Poland are Native Hawaiian (15.7%, a difference of 0.020%), Pakistani (15.7%, a difference of 0.030%), Immigrants from Australia (15.7%, a difference of 0.070%), Australian (15.7%, a difference of 0.080%), and South American Indian (15.7%, a difference of 0.11%).
| Demographics | Rating | Rank | Single Father Poverty |
| Immigrants | Middle Africa | 97.4 /100 | #99 | Exceptional 15.6% |
| Immigrants | Chile | 96.9 /100 | #100 | Exceptional 15.7% |
| Fijians | 96.8 /100 | #101 | Exceptional 15.7% |
| Chileans | 96.4 /100 | #102 | Exceptional 15.7% |
| South American Indians | 96.2 /100 | #103 | Exceptional 15.7% |
| Australians | 96.1 /100 | #104 | Exceptional 15.7% |
| Immigrants | Australia | 96.1 /100 | #105 | Exceptional 15.7% |
| Immigrants | Poland | 95.8 /100 | #106 | Exceptional 15.7% |
| Native Hawaiians | 95.8 /100 | #107 | Exceptional 15.7% |
| Pakistanis | 95.7 /100 | #108 | Exceptional 15.7% |
| Turks | 95.1 /100 | #109 | Exceptional 15.8% |
| Immigrants | Africa | 95.1 /100 | #110 | Exceptional 15.8% |
| Bulgarians | 94.8 /100 | #111 | Exceptional 15.8% |
| Immigrants | Latvia | 94.7 /100 | #112 | Exceptional 15.8% |
| Danes | 94.5 /100 | #113 | Exceptional 15.8% |