Pakistani vs Immigrants from Ecuador Single Mother Poverty
COMPARE
Pakistani
Immigrants from Ecuador
Single Mother Poverty
Single Mother Poverty Comparison
Pakistanis
Immigrants from Ecuador
28.0%
SINGLE MOTHER POVERTY
96.9/ 100
METRIC RATING
101st/ 347
METRIC RANK
31.3%
SINGLE MOTHER POVERTY
0.2/ 100
METRIC RATING
264th/ 347
METRIC RANK
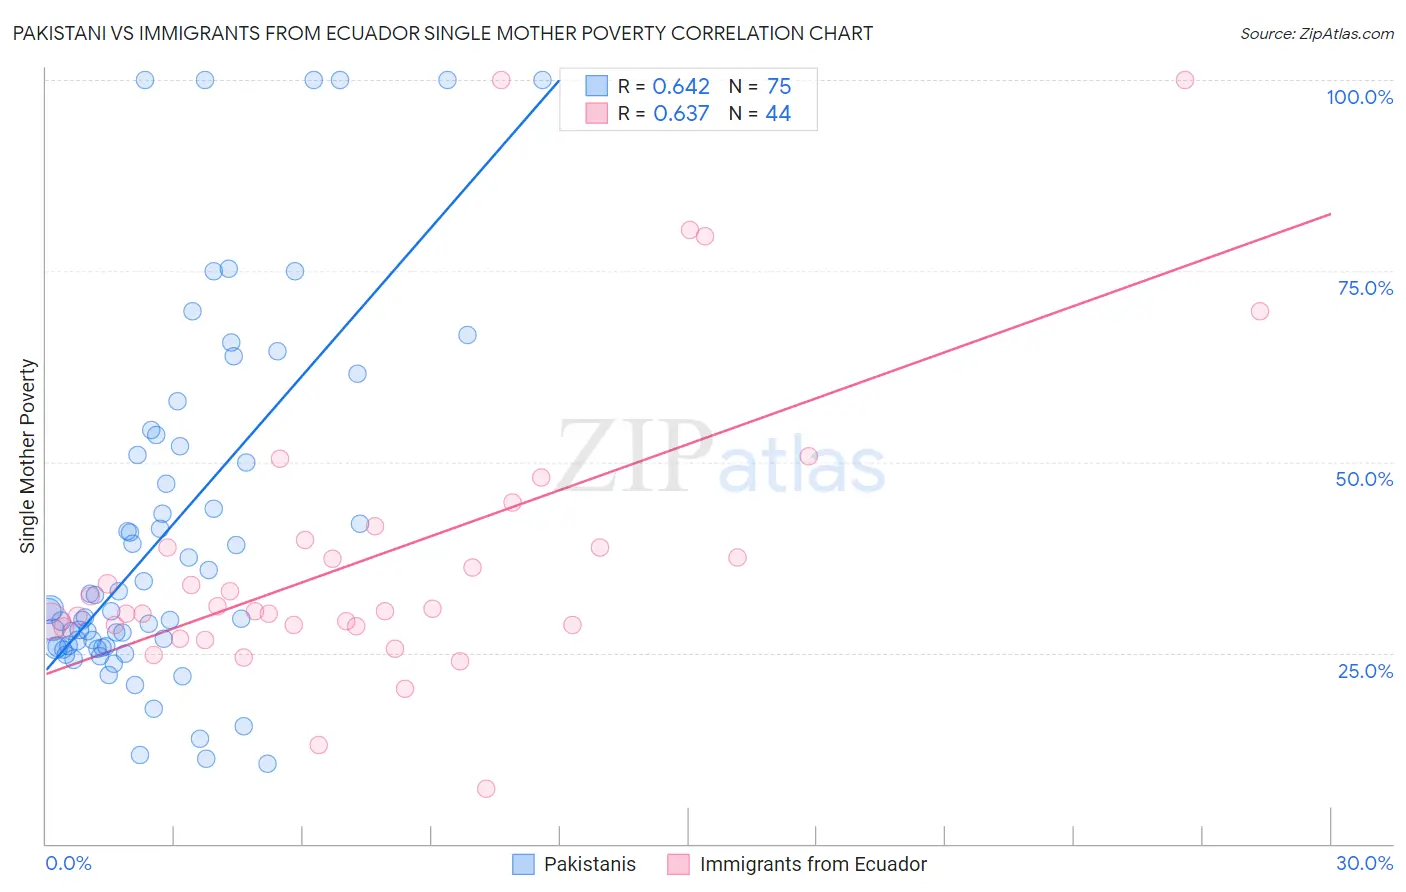
Pakistani vs Immigrants from Ecuador Single Mother Poverty Correlation Chart
The statistical analysis conducted on geographies consisting of 329,467,597 people shows a significant positive correlation between the proportion of Pakistanis and poverty level among single mothers in the United States with a correlation coefficient (R) of 0.642 and weighted average of 28.0%. Similarly, the statistical analysis conducted on geographies consisting of 266,047,722 people shows a significant positive correlation between the proportion of Immigrants from Ecuador and poverty level among single mothers in the United States with a correlation coefficient (R) of 0.637 and weighted average of 31.3%, a difference of 12.1%.
Single Mother Poverty Correlation Summary
| Measurement | Pakistani | Immigrants from Ecuador |
| Minimum | 10.5% | 7.3% |
| Maximum | 100.0% | 100.0% |
| Range | 89.5% | 92.7% |
| Mean | 41.1% | 37.8% |
| Median | 30.5% | 30.6% |
| Interquartile 25% (IQ1) | 25.8% | 28.6% |
| Interquartile 75% (IQ3) | 52.0% | 39.3% |
| Interquartile Range (IQR) | 26.2% | 10.8% |
| Standard Deviation (Sample) | 23.5% | 19.7% |
| Standard Deviation (Population) | 23.3% | 19.5% |
Similar Demographics by Single Mother Poverty
Demographics Similar to Pakistanis by Single Mother Poverty
In terms of single mother poverty, the demographic groups most similar to Pakistanis are Zimbabwean (27.9%, a difference of 0.070%), Immigrants from Croatia (28.0%, a difference of 0.10%), Immigrants from Netherlands (27.9%, a difference of 0.11%), Immigrants from Nepal (27.9%, a difference of 0.12%), and Immigrants from Northern Africa (28.0%, a difference of 0.12%).
| Demographics | Rating | Rank | Single Mother Poverty |
| Albanians | 97.6 /100 | #94 | Exceptional 27.9% |
| Chileans | 97.5 /100 | #95 | Exceptional 27.9% |
| Immigrants | Iraq | 97.3 /100 | #96 | Exceptional 27.9% |
| Immigrants | Brazil | 97.2 /100 | #97 | Exceptional 27.9% |
| Immigrants | Nepal | 97.2 /100 | #98 | Exceptional 27.9% |
| Immigrants | Netherlands | 97.2 /100 | #99 | Exceptional 27.9% |
| Zimbabweans | 97.1 /100 | #100 | Exceptional 27.9% |
| Pakistanis | 96.9 /100 | #101 | Exceptional 28.0% |
| Immigrants | Croatia | 96.7 /100 | #102 | Exceptional 28.0% |
| Immigrants | Northern Africa | 96.6 /100 | #103 | Exceptional 28.0% |
| Italians | 96.6 /100 | #104 | Exceptional 28.0% |
| Israelis | 96.5 /100 | #105 | Exceptional 28.0% |
| Ukrainians | 96.4 /100 | #106 | Exceptional 28.0% |
| Immigrants | Venezuela | 95.8 /100 | #107 | Exceptional 28.1% |
| Immigrants | Zimbabwe | 95.5 /100 | #108 | Exceptional 28.1% |
Demographics Similar to Immigrants from Ecuador by Single Mother Poverty
In terms of single mother poverty, the demographic groups most similar to Immigrants from Ecuador are Bahamian (31.3%, a difference of 0.020%), German Russian (31.3%, a difference of 0.030%), Subsaharan African (31.4%, a difference of 0.090%), Immigrants from Belize (31.4%, a difference of 0.25%), and Hmong (31.2%, a difference of 0.28%).
| Demographics | Rating | Rank | Single Mother Poverty |
| Immigrants | Bahamas | 0.4 /100 | #257 | Tragic 31.1% |
| Immigrants | Caribbean | 0.4 /100 | #258 | Tragic 31.1% |
| Immigrants | Bangladesh | 0.4 /100 | #259 | Tragic 31.1% |
| Whites/Caucasians | 0.3 /100 | #260 | Tragic 31.2% |
| Immigrants | El Salvador | 0.3 /100 | #261 | Tragic 31.2% |
| Hmong | 0.3 /100 | #262 | Tragic 31.2% |
| Bahamians | 0.2 /100 | #263 | Tragic 31.3% |
| Immigrants | Ecuador | 0.2 /100 | #264 | Tragic 31.3% |
| German Russians | 0.2 /100 | #265 | Tragic 31.3% |
| Sub-Saharan Africans | 0.2 /100 | #266 | Tragic 31.4% |
| Immigrants | Belize | 0.2 /100 | #267 | Tragic 31.4% |
| Immigrants | Senegal | 0.1 /100 | #268 | Tragic 31.5% |
| Scotch-Irish | 0.1 /100 | #269 | Tragic 31.5% |
| British West Indians | 0.1 /100 | #270 | Tragic 31.5% |
| Immigrants | Cabo Verde | 0.1 /100 | #271 | Tragic 31.6% |