Immigrants from Japan vs Immigrants from Ecuador Single Mother Poverty
COMPARE
Immigrants from Japan
Immigrants from Ecuador
Single Mother Poverty
Single Mother Poverty Comparison
Immigrants from Japan
Immigrants from Ecuador
26.4%
SINGLE MOTHER POVERTY
100.0/ 100
METRIC RATING
27th/ 347
METRIC RANK
31.3%
SINGLE MOTHER POVERTY
0.2/ 100
METRIC RATING
264th/ 347
METRIC RANK
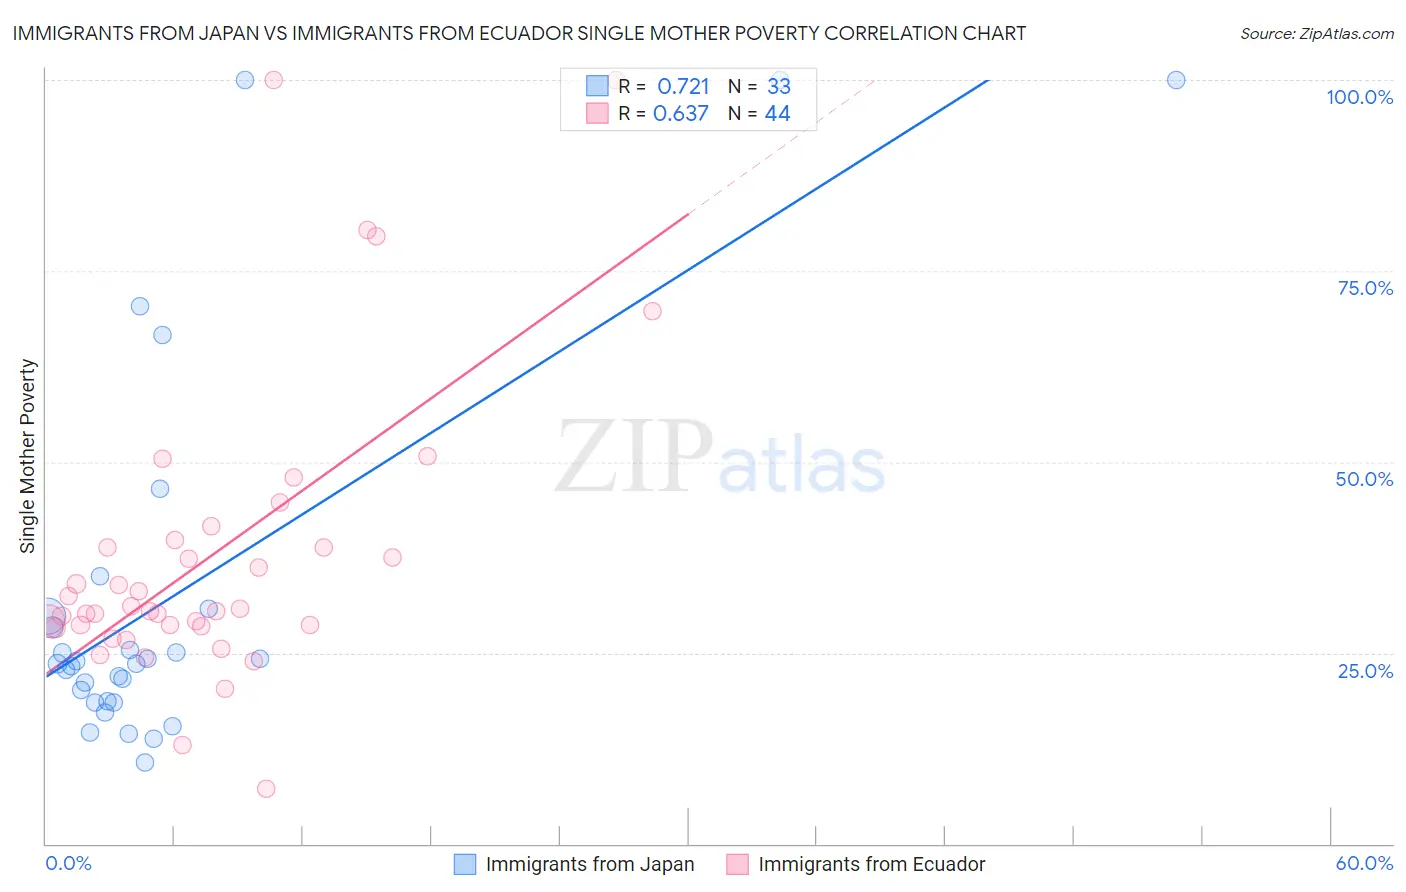
Immigrants from Japan vs Immigrants from Ecuador Single Mother Poverty Correlation Chart
The statistical analysis conducted on geographies consisting of 332,940,354 people shows a strong positive correlation between the proportion of Immigrants from Japan and poverty level among single mothers in the United States with a correlation coefficient (R) of 0.721 and weighted average of 26.4%. Similarly, the statistical analysis conducted on geographies consisting of 266,047,722 people shows a significant positive correlation between the proportion of Immigrants from Ecuador and poverty level among single mothers in the United States with a correlation coefficient (R) of 0.637 and weighted average of 31.3%, a difference of 18.7%.
Single Mother Poverty Correlation Summary
| Measurement | Immigrants from Japan | Immigrants from Ecuador |
| Minimum | 10.7% | 7.3% |
| Maximum | 100.0% | 100.0% |
| Range | 89.3% | 92.7% |
| Mean | 32.6% | 37.8% |
| Median | 23.6% | 30.6% |
| Interquartile 25% (IQ1) | 18.6% | 28.6% |
| Interquartile 75% (IQ3) | 30.2% | 39.3% |
| Interquartile Range (IQR) | 11.6% | 10.8% |
| Standard Deviation (Sample) | 25.2% | 19.7% |
| Standard Deviation (Population) | 24.8% | 19.5% |
Similar Demographics by Single Mother Poverty
Demographics Similar to Immigrants from Japan by Single Mother Poverty
In terms of single mother poverty, the demographic groups most similar to Immigrants from Japan are Korean (26.4%, a difference of 0.010%), Jordanian (26.4%, a difference of 0.070%), Turkish (26.4%, a difference of 0.15%), Immigrants from Sri Lanka (26.3%, a difference of 0.22%), and Immigrants from Philippines (26.5%, a difference of 0.31%).
| Demographics | Rating | Rank | Single Mother Poverty |
| Immigrants | China | 100.0 /100 | #20 | Exceptional 26.1% |
| Immigrants | Bolivia | 100.0 /100 | #21 | Exceptional 26.2% |
| Immigrants | Korea | 100.0 /100 | #22 | Exceptional 26.2% |
| Burmese | 100.0 /100 | #23 | Exceptional 26.2% |
| Immigrants | Moldova | 100.0 /100 | #24 | Exceptional 26.2% |
| Immigrants | Asia | 100.0 /100 | #25 | Exceptional 26.3% |
| Immigrants | Sri Lanka | 100.0 /100 | #26 | Exceptional 26.3% |
| Immigrants | Japan | 100.0 /100 | #27 | Exceptional 26.4% |
| Koreans | 100.0 /100 | #28 | Exceptional 26.4% |
| Jordanians | 100.0 /100 | #29 | Exceptional 26.4% |
| Turks | 100.0 /100 | #30 | Exceptional 26.4% |
| Immigrants | Philippines | 100.0 /100 | #31 | Exceptional 26.5% |
| Tongans | 99.9 /100 | #32 | Exceptional 26.5% |
| Bulgarians | 99.9 /100 | #33 | Exceptional 26.5% |
| Immigrants | Indonesia | 99.9 /100 | #34 | Exceptional 26.6% |
Demographics Similar to Immigrants from Ecuador by Single Mother Poverty
In terms of single mother poverty, the demographic groups most similar to Immigrants from Ecuador are Bahamian (31.3%, a difference of 0.020%), German Russian (31.3%, a difference of 0.030%), Subsaharan African (31.4%, a difference of 0.090%), Immigrants from Belize (31.4%, a difference of 0.25%), and Hmong (31.2%, a difference of 0.28%).
| Demographics | Rating | Rank | Single Mother Poverty |
| Immigrants | Bahamas | 0.4 /100 | #257 | Tragic 31.1% |
| Immigrants | Caribbean | 0.4 /100 | #258 | Tragic 31.1% |
| Immigrants | Bangladesh | 0.4 /100 | #259 | Tragic 31.1% |
| Whites/Caucasians | 0.3 /100 | #260 | Tragic 31.2% |
| Immigrants | El Salvador | 0.3 /100 | #261 | Tragic 31.2% |
| Hmong | 0.3 /100 | #262 | Tragic 31.2% |
| Bahamians | 0.2 /100 | #263 | Tragic 31.3% |
| Immigrants | Ecuador | 0.2 /100 | #264 | Tragic 31.3% |
| German Russians | 0.2 /100 | #265 | Tragic 31.3% |
| Sub-Saharan Africans | 0.2 /100 | #266 | Tragic 31.4% |
| Immigrants | Belize | 0.2 /100 | #267 | Tragic 31.4% |
| Immigrants | Senegal | 0.1 /100 | #268 | Tragic 31.5% |
| Scotch-Irish | 0.1 /100 | #269 | Tragic 31.5% |
| British West Indians | 0.1 /100 | #270 | Tragic 31.5% |
| Immigrants | Cabo Verde | 0.1 /100 | #271 | Tragic 31.6% |