Arab vs Immigrants from Ecuador Single Mother Poverty
COMPARE
Arab
Immigrants from Ecuador
Single Mother Poverty
Single Mother Poverty Comparison
Arabs
Immigrants from Ecuador
29.0%
SINGLE MOTHER POVERTY
60.7/ 100
METRIC RATING
165th/ 347
METRIC RANK
31.3%
SINGLE MOTHER POVERTY
0.2/ 100
METRIC RATING
264th/ 347
METRIC RANK
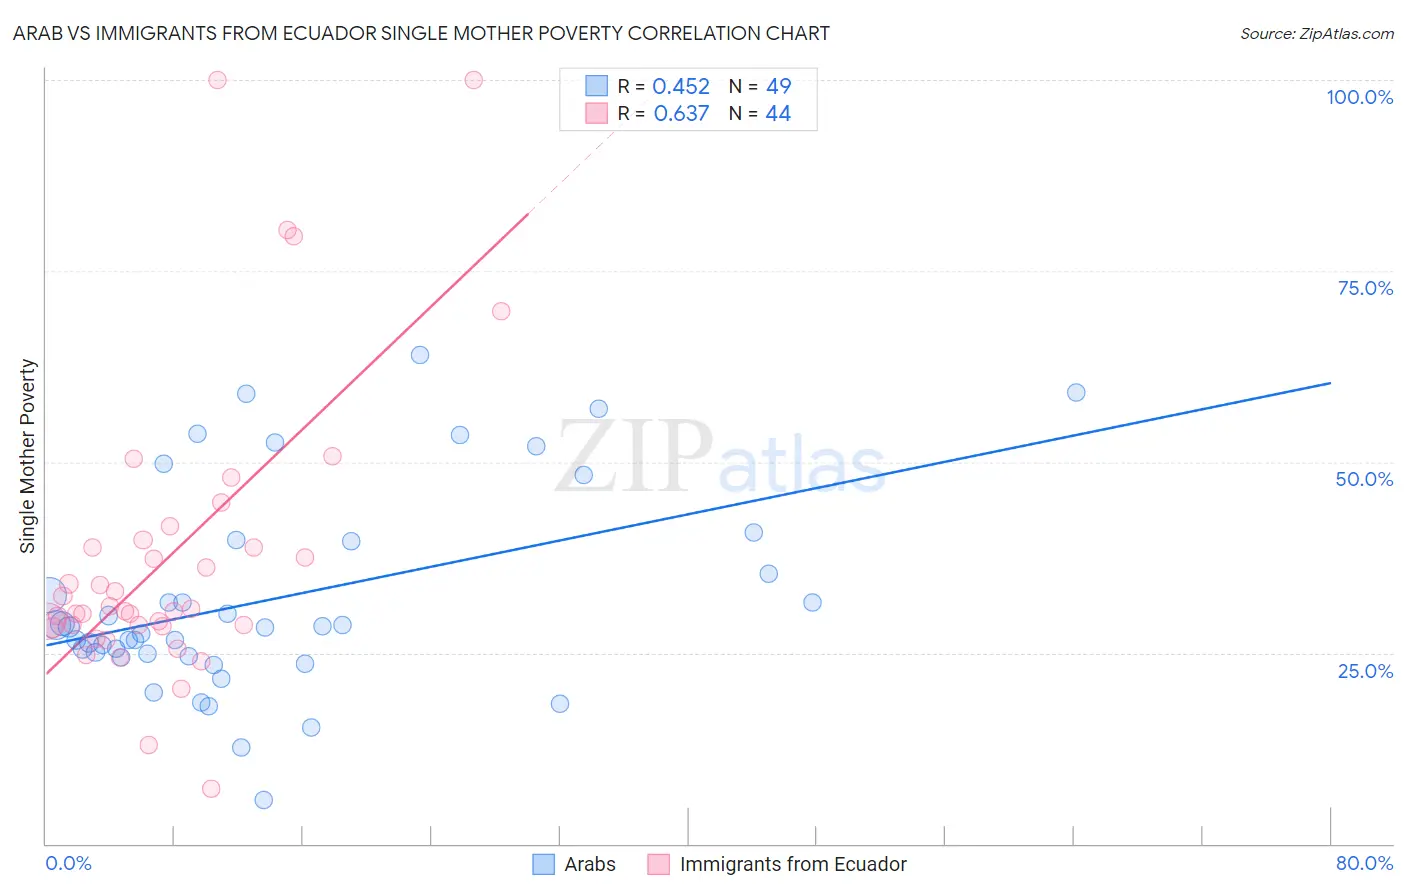
Arab vs Immigrants from Ecuador Single Mother Poverty Correlation Chart
The statistical analysis conducted on geographies consisting of 470,668,307 people shows a moderate positive correlation between the proportion of Arabs and poverty level among single mothers in the United States with a correlation coefficient (R) of 0.452 and weighted average of 29.0%. Similarly, the statistical analysis conducted on geographies consisting of 266,047,722 people shows a significant positive correlation between the proportion of Immigrants from Ecuador and poverty level among single mothers in the United States with a correlation coefficient (R) of 0.637 and weighted average of 31.3%, a difference of 8.0%.
Single Mother Poverty Correlation Summary
| Measurement | Arab | Immigrants from Ecuador |
| Minimum | 5.8% | 7.3% |
| Maximum | 63.9% | 100.0% |
| Range | 58.1% | 92.7% |
| Mean | 32.2% | 37.8% |
| Median | 28.4% | 30.6% |
| Interquartile 25% (IQ1) | 24.8% | 28.6% |
| Interquartile 75% (IQ3) | 39.7% | 39.3% |
| Interquartile Range (IQR) | 14.9% | 10.8% |
| Standard Deviation (Sample) | 13.3% | 19.7% |
| Standard Deviation (Population) | 13.2% | 19.5% |
Similar Demographics by Single Mother Poverty
Demographics Similar to Arabs by Single Mother Poverty
In terms of single mother poverty, the demographic groups most similar to Arabs are Inupiat (29.0%, a difference of 0.020%), Costa Rican (29.0%, a difference of 0.12%), European (29.1%, a difference of 0.16%), Immigrants from Uruguay (29.1%, a difference of 0.17%), and Immigrants from Nigeria (28.9%, a difference of 0.27%).
| Demographics | Rating | Rank | Single Mother Poverty |
| Immigrants | Hungary | 70.6 /100 | #158 | Good 28.9% |
| Czechs | 68.4 /100 | #159 | Good 28.9% |
| Japanese | 68.0 /100 | #160 | Good 28.9% |
| Immigrants | Cambodia | 66.6 /100 | #161 | Good 28.9% |
| Scandinavians | 66.2 /100 | #162 | Good 28.9% |
| Immigrants | Nigeria | 65.9 /100 | #163 | Good 28.9% |
| Immigrants | Kenya | 65.9 /100 | #164 | Good 28.9% |
| Arabs | 60.7 /100 | #165 | Good 29.0% |
| Inupiat | 60.4 /100 | #166 | Good 29.0% |
| Costa Ricans | 58.4 /100 | #167 | Average 29.0% |
| Europeans | 57.6 /100 | #168 | Average 29.1% |
| Immigrants | Uruguay | 57.2 /100 | #169 | Average 29.1% |
| New Zealanders | 55.1 /100 | #170 | Average 29.1% |
| Puget Sound Salish | 55.1 /100 | #171 | Average 29.1% |
| Carpatho Rusyns | 53.8 /100 | #172 | Average 29.1% |
Demographics Similar to Immigrants from Ecuador by Single Mother Poverty
In terms of single mother poverty, the demographic groups most similar to Immigrants from Ecuador are Bahamian (31.3%, a difference of 0.020%), German Russian (31.3%, a difference of 0.030%), Subsaharan African (31.4%, a difference of 0.090%), Immigrants from Belize (31.4%, a difference of 0.25%), and Hmong (31.2%, a difference of 0.28%).
| Demographics | Rating | Rank | Single Mother Poverty |
| Immigrants | Bahamas | 0.4 /100 | #257 | Tragic 31.1% |
| Immigrants | Caribbean | 0.4 /100 | #258 | Tragic 31.1% |
| Immigrants | Bangladesh | 0.4 /100 | #259 | Tragic 31.1% |
| Whites/Caucasians | 0.3 /100 | #260 | Tragic 31.2% |
| Immigrants | El Salvador | 0.3 /100 | #261 | Tragic 31.2% |
| Hmong | 0.3 /100 | #262 | Tragic 31.2% |
| Bahamians | 0.2 /100 | #263 | Tragic 31.3% |
| Immigrants | Ecuador | 0.2 /100 | #264 | Tragic 31.3% |
| German Russians | 0.2 /100 | #265 | Tragic 31.3% |
| Sub-Saharan Africans | 0.2 /100 | #266 | Tragic 31.4% |
| Immigrants | Belize | 0.2 /100 | #267 | Tragic 31.4% |
| Immigrants | Senegal | 0.1 /100 | #268 | Tragic 31.5% |
| Scotch-Irish | 0.1 /100 | #269 | Tragic 31.5% |
| British West Indians | 0.1 /100 | #270 | Tragic 31.5% |
| Immigrants | Cabo Verde | 0.1 /100 | #271 | Tragic 31.6% |