Tlingit-Haida vs Filipino Child Poverty Among Girls Under 16
COMPARE
Tlingit-Haida
Filipino
Child Poverty Among Girls Under 16
Child Poverty Among Girls Under 16 Comparison
Tlingit-Haida
Filipinos
14.7%
CHILD POVERTY AMONG GIRLS UNDER 16
97.9/ 100
METRIC RATING
77th/ 347
METRIC RANK
11.4%
CHILD POVERTY AMONG GIRLS UNDER 16
100.0/ 100
METRIC RATING
3rd/ 347
METRIC RANK
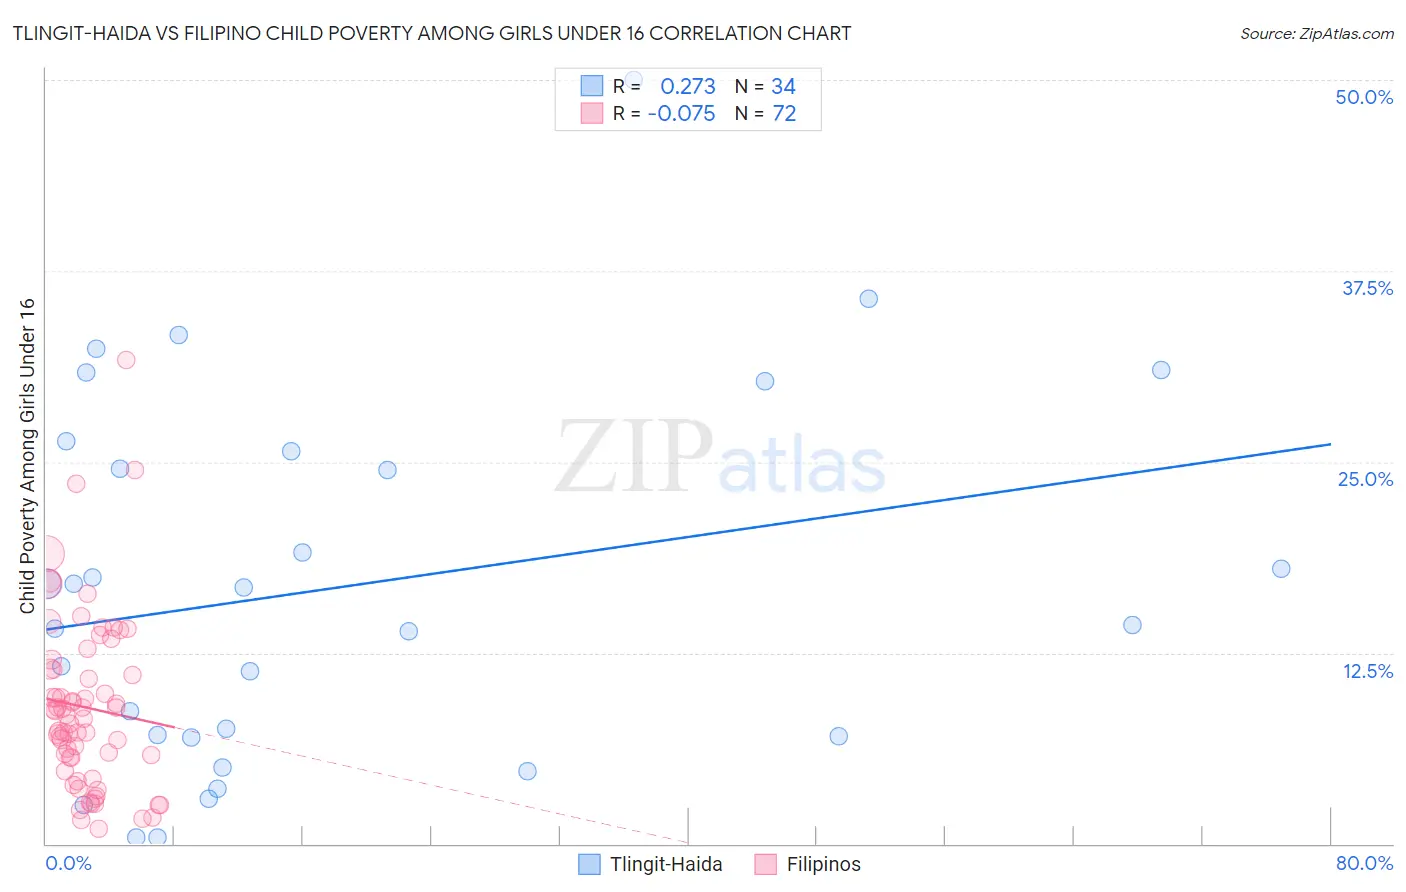
Tlingit-Haida vs Filipino Child Poverty Among Girls Under 16 Correlation Chart
The statistical analysis conducted on geographies consisting of 60,606,017 people shows a weak positive correlation between the proportion of Tlingit-Haida and poverty level among girls under the age of 16 in the United States with a correlation coefficient (R) of 0.273 and weighted average of 14.7%. Similarly, the statistical analysis conducted on geographies consisting of 250,600,431 people shows a slight negative correlation between the proportion of Filipinos and poverty level among girls under the age of 16 in the United States with a correlation coefficient (R) of -0.075 and weighted average of 11.4%, a difference of 28.4%.
Child Poverty Among Girls Under 16 Correlation Summary
| Measurement | Tlingit-Haida | Filipino |
| Minimum | 0.43% | 0.99% |
| Maximum | 50.0% | 31.6% |
| Range | 49.6% | 30.7% |
| Mean | 16.8% | 8.9% |
| Median | 15.6% | 8.3% |
| Interquartile 25% (IQ1) | 7.0% | 5.2% |
| Interquartile 75% (IQ3) | 25.7% | 11.4% |
| Interquartile Range (IQR) | 18.7% | 6.3% |
| Standard Deviation (Sample) | 12.0% | 5.7% |
| Standard Deviation (Population) | 11.8% | 5.7% |
Similar Demographics by Child Poverty Among Girls Under 16
Demographics Similar to Tlingit-Haida by Child Poverty Among Girls Under 16
In terms of child poverty among girls under 16, the demographic groups most similar to Tlingit-Haida are Immigrants from Russia (14.7%, a difference of 0.010%), Argentinean (14.7%, a difference of 0.010%), Immigrants from Turkey (14.7%, a difference of 0.020%), Egyptian (14.7%, a difference of 0.030%), and Immigrants from Eastern Europe (14.6%, a difference of 0.16%).
| Demographics | Rating | Rank | Child Poverty Among Girls Under 16 |
| Europeans | 98.1 /100 | #70 | Exceptional 14.6% |
| Slovenes | 98.1 /100 | #71 | Exceptional 14.6% |
| Immigrants | Netherlands | 98.1 /100 | #72 | Exceptional 14.6% |
| Immigrants | Austria | 98.0 /100 | #73 | Exceptional 14.6% |
| Taiwanese | 98.0 /100 | #74 | Exceptional 14.6% |
| Immigrants | Eastern Europe | 98.0 /100 | #75 | Exceptional 14.6% |
| Immigrants | Russia | 97.9 /100 | #76 | Exceptional 14.7% |
| Tlingit-Haida | 97.9 /100 | #77 | Exceptional 14.7% |
| Argentineans | 97.9 /100 | #78 | Exceptional 14.7% |
| Immigrants | Turkey | 97.9 /100 | #79 | Exceptional 14.7% |
| Egyptians | 97.9 /100 | #80 | Exceptional 14.7% |
| Ukrainians | 97.7 /100 | #81 | Exceptional 14.7% |
| Macedonians | 97.6 /100 | #82 | Exceptional 14.7% |
| Immigrants | Italy | 97.4 /100 | #83 | Exceptional 14.8% |
| Soviet Union | 97.3 /100 | #84 | Exceptional 14.8% |
Demographics Similar to Filipinos by Child Poverty Among Girls Under 16
In terms of child poverty among girls under 16, the demographic groups most similar to Filipinos are Tsimshian (11.5%, a difference of 0.52%), Immigrants from Taiwan (11.3%, a difference of 0.87%), Immigrants from India (11.0%, a difference of 3.5%), Thai (11.8%, a difference of 3.6%), and Immigrants from Hong Kong (12.3%, a difference of 8.0%).
| Demographics | Rating | Rank | Child Poverty Among Girls Under 16 |
| Immigrants | India | 100.0 /100 | #1 | Exceptional 11.0% |
| Immigrants | Taiwan | 100.0 /100 | #2 | Exceptional 11.3% |
| Filipinos | 100.0 /100 | #3 | Exceptional 11.4% |
| Tsimshian | 100.0 /100 | #4 | Exceptional 11.5% |
| Thais | 100.0 /100 | #5 | Exceptional 11.8% |
| Immigrants | Hong Kong | 100.0 /100 | #6 | Exceptional 12.3% |
| Chinese | 100.0 /100 | #7 | Exceptional 12.3% |
| Iranians | 100.0 /100 | #8 | Exceptional 12.4% |
| Immigrants | Singapore | 100.0 /100 | #9 | Exceptional 12.5% |
| Immigrants | Iran | 100.0 /100 | #10 | Exceptional 12.6% |
| Immigrants | South Central Asia | 100.0 /100 | #11 | Exceptional 12.7% |
| Bhutanese | 100.0 /100 | #12 | Exceptional 12.7% |
| Immigrants | Ireland | 99.9 /100 | #13 | Exceptional 12.9% |
| Burmese | 99.9 /100 | #14 | Exceptional 13.0% |
| Okinawans | 99.9 /100 | #15 | Exceptional 13.0% |