Immigrants from Bahamas vs Filipino Child Poverty Among Girls Under 16
COMPARE
Immigrants from Bahamas
Filipino
Child Poverty Among Girls Under 16
Child Poverty Among Girls Under 16 Comparison
Immigrants from Bahamas
Filipinos
21.4%
CHILD POVERTY AMONG GIRLS UNDER 16
0.0/ 100
METRIC RATING
307th/ 347
METRIC RANK
11.4%
CHILD POVERTY AMONG GIRLS UNDER 16
100.0/ 100
METRIC RATING
3rd/ 347
METRIC RANK
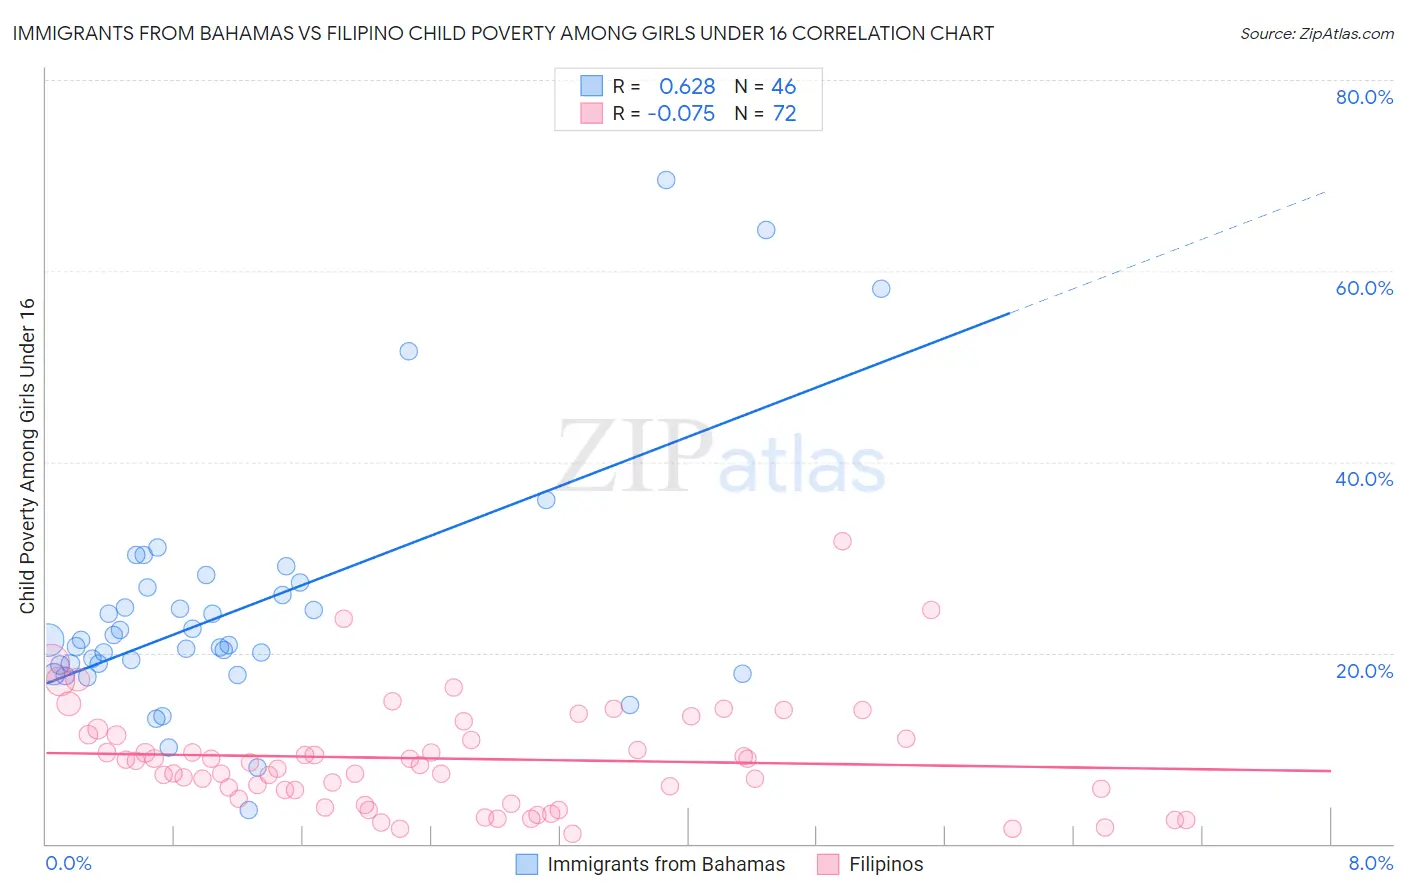
Immigrants from Bahamas vs Filipino Child Poverty Among Girls Under 16 Correlation Chart
The statistical analysis conducted on geographies consisting of 104,297,858 people shows a significant positive correlation between the proportion of Immigrants from Bahamas and poverty level among girls under the age of 16 in the United States with a correlation coefficient (R) of 0.628 and weighted average of 21.4%. Similarly, the statistical analysis conducted on geographies consisting of 250,600,431 people shows a slight negative correlation between the proportion of Filipinos and poverty level among girls under the age of 16 in the United States with a correlation coefficient (R) of -0.075 and weighted average of 11.4%, a difference of 87.8%.
Child Poverty Among Girls Under 16 Correlation Summary
| Measurement | Immigrants from Bahamas | Filipino |
| Minimum | 3.5% | 0.99% |
| Maximum | 69.5% | 31.6% |
| Range | 66.0% | 30.7% |
| Mean | 24.5% | 8.9% |
| Median | 21.1% | 8.3% |
| Interquartile 25% (IQ1) | 18.7% | 5.2% |
| Interquartile 75% (IQ3) | 26.9% | 11.4% |
| Interquartile Range (IQR) | 8.2% | 6.3% |
| Standard Deviation (Sample) | 13.0% | 5.7% |
| Standard Deviation (Population) | 12.8% | 5.7% |
Similar Demographics by Child Poverty Among Girls Under 16
Demographics Similar to Immigrants from Bahamas by Child Poverty Among Girls Under 16
In terms of child poverty among girls under 16, the demographic groups most similar to Immigrants from Bahamas are Immigrants from Central America (21.4%, a difference of 0.010%), Guatemalan (21.4%, a difference of 0.18%), Houma (21.5%, a difference of 0.18%), Bahamian (21.5%, a difference of 0.30%), and Immigrants from Somalia (21.6%, a difference of 0.57%).
| Demographics | Rating | Rank | Child Poverty Among Girls Under 16 |
| Somalis | 0.0 /100 | #300 | Tragic 21.0% |
| Choctaw | 0.0 /100 | #301 | Tragic 21.1% |
| Seminole | 0.0 /100 | #302 | Tragic 21.2% |
| British West Indians | 0.0 /100 | #303 | Tragic 21.3% |
| Indonesians | 0.0 /100 | #304 | Tragic 21.3% |
| Guatemalans | 0.0 /100 | #305 | Tragic 21.4% |
| Immigrants | Central America | 0.0 /100 | #306 | Tragic 21.4% |
| Immigrants | Bahamas | 0.0 /100 | #307 | Tragic 21.4% |
| Houma | 0.0 /100 | #308 | Tragic 21.5% |
| Bahamians | 0.0 /100 | #309 | Tragic 21.5% |
| Immigrants | Somalia | 0.0 /100 | #310 | Tragic 21.6% |
| Dutch West Indians | 0.0 /100 | #311 | Tragic 21.6% |
| Immigrants | Mexico | 0.0 /100 | #312 | Tragic 21.6% |
| Creek | 0.0 /100 | #313 | Tragic 21.7% |
| Arapaho | 0.0 /100 | #314 | Tragic 21.7% |
Demographics Similar to Filipinos by Child Poverty Among Girls Under 16
In terms of child poverty among girls under 16, the demographic groups most similar to Filipinos are Tsimshian (11.5%, a difference of 0.52%), Immigrants from Taiwan (11.3%, a difference of 0.87%), Immigrants from India (11.0%, a difference of 3.5%), Thai (11.8%, a difference of 3.6%), and Immigrants from Hong Kong (12.3%, a difference of 8.0%).
| Demographics | Rating | Rank | Child Poverty Among Girls Under 16 |
| Immigrants | India | 100.0 /100 | #1 | Exceptional 11.0% |
| Immigrants | Taiwan | 100.0 /100 | #2 | Exceptional 11.3% |
| Filipinos | 100.0 /100 | #3 | Exceptional 11.4% |
| Tsimshian | 100.0 /100 | #4 | Exceptional 11.5% |
| Thais | 100.0 /100 | #5 | Exceptional 11.8% |
| Immigrants | Hong Kong | 100.0 /100 | #6 | Exceptional 12.3% |
| Chinese | 100.0 /100 | #7 | Exceptional 12.3% |
| Iranians | 100.0 /100 | #8 | Exceptional 12.4% |
| Immigrants | Singapore | 100.0 /100 | #9 | Exceptional 12.5% |
| Immigrants | Iran | 100.0 /100 | #10 | Exceptional 12.6% |
| Immigrants | South Central Asia | 100.0 /100 | #11 | Exceptional 12.7% |
| Bhutanese | 100.0 /100 | #12 | Exceptional 12.7% |
| Immigrants | Ireland | 99.9 /100 | #13 | Exceptional 12.9% |
| Burmese | 99.9 /100 | #14 | Exceptional 13.0% |
| Okinawans | 99.9 /100 | #15 | Exceptional 13.0% |