Tlingit-Haida vs Spaniard Child Poverty Among Girls Under 16
COMPARE
Tlingit-Haida
Spaniard
Child Poverty Among Girls Under 16
Child Poverty Among Girls Under 16 Comparison
Tlingit-Haida
Spaniards
14.7%
CHILD POVERTY AMONG GIRLS UNDER 16
97.9/ 100
METRIC RATING
77th/ 347
METRIC RANK
17.0%
CHILD POVERTY AMONG GIRLS UNDER 16
24.9/ 100
METRIC RATING
197th/ 347
METRIC RANK
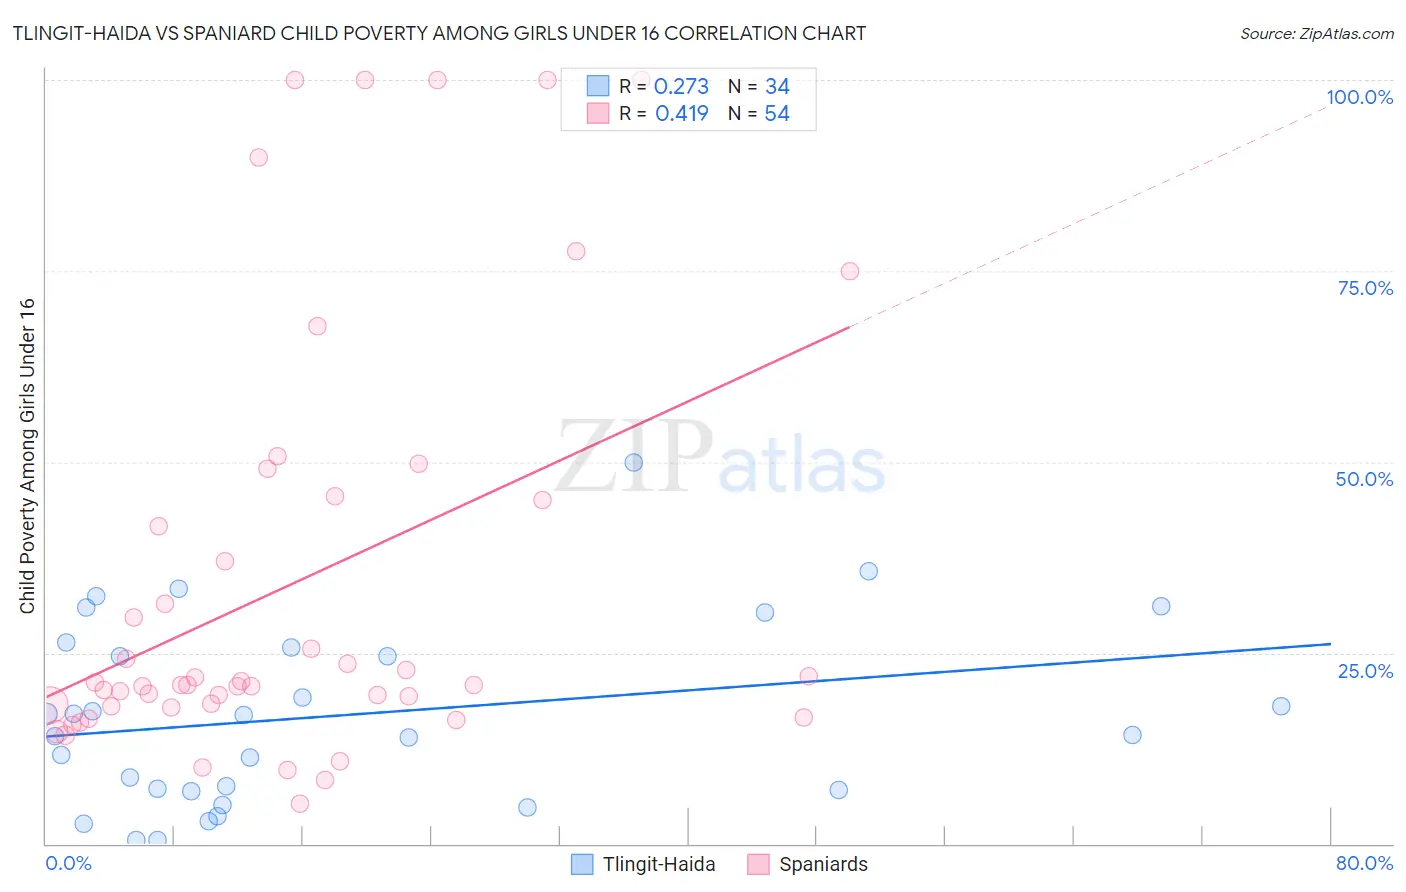
Tlingit-Haida vs Spaniard Child Poverty Among Girls Under 16 Correlation Chart
The statistical analysis conducted on geographies consisting of 60,606,017 people shows a weak positive correlation between the proportion of Tlingit-Haida and poverty level among girls under the age of 16 in the United States with a correlation coefficient (R) of 0.273 and weighted average of 14.7%. Similarly, the statistical analysis conducted on geographies consisting of 434,393,372 people shows a moderate positive correlation between the proportion of Spaniards and poverty level among girls under the age of 16 in the United States with a correlation coefficient (R) of 0.419 and weighted average of 17.0%, a difference of 15.9%.
Child Poverty Among Girls Under 16 Correlation Summary
| Measurement | Tlingit-Haida | Spaniard |
| Minimum | 0.43% | 5.3% |
| Maximum | 50.0% | 100.0% |
| Range | 49.6% | 94.7% |
| Mean | 16.8% | 34.1% |
| Median | 15.6% | 20.8% |
| Interquartile 25% (IQ1) | 7.0% | 18.0% |
| Interquartile 75% (IQ3) | 25.7% | 44.9% |
| Interquartile Range (IQR) | 18.7% | 26.9% |
| Standard Deviation (Sample) | 12.0% | 27.7% |
| Standard Deviation (Population) | 11.8% | 27.4% |
Similar Demographics by Child Poverty Among Girls Under 16
Demographics Similar to Tlingit-Haida by Child Poverty Among Girls Under 16
In terms of child poverty among girls under 16, the demographic groups most similar to Tlingit-Haida are Immigrants from Russia (14.7%, a difference of 0.010%), Argentinean (14.7%, a difference of 0.010%), Immigrants from Turkey (14.7%, a difference of 0.020%), Egyptian (14.7%, a difference of 0.030%), and Immigrants from Eastern Europe (14.6%, a difference of 0.16%).
| Demographics | Rating | Rank | Child Poverty Among Girls Under 16 |
| Europeans | 98.1 /100 | #70 | Exceptional 14.6% |
| Slovenes | 98.1 /100 | #71 | Exceptional 14.6% |
| Immigrants | Netherlands | 98.1 /100 | #72 | Exceptional 14.6% |
| Immigrants | Austria | 98.0 /100 | #73 | Exceptional 14.6% |
| Taiwanese | 98.0 /100 | #74 | Exceptional 14.6% |
| Immigrants | Eastern Europe | 98.0 /100 | #75 | Exceptional 14.6% |
| Immigrants | Russia | 97.9 /100 | #76 | Exceptional 14.7% |
| Tlingit-Haida | 97.9 /100 | #77 | Exceptional 14.7% |
| Argentineans | 97.9 /100 | #78 | Exceptional 14.7% |
| Immigrants | Turkey | 97.9 /100 | #79 | Exceptional 14.7% |
| Egyptians | 97.9 /100 | #80 | Exceptional 14.7% |
| Ukrainians | 97.7 /100 | #81 | Exceptional 14.7% |
| Macedonians | 97.6 /100 | #82 | Exceptional 14.7% |
| Immigrants | Italy | 97.4 /100 | #83 | Exceptional 14.8% |
| Soviet Union | 97.3 /100 | #84 | Exceptional 14.8% |
Demographics Similar to Spaniards by Child Poverty Among Girls Under 16
In terms of child poverty among girls under 16, the demographic groups most similar to Spaniards are Celtic (17.0%, a difference of 0.050%), Immigrants from Costa Rica (17.0%, a difference of 0.11%), Immigrants from Lebanon (17.1%, a difference of 0.35%), Immigrants from Afghanistan (17.1%, a difference of 0.38%), and Spanish (16.9%, a difference of 0.53%).
| Demographics | Rating | Rank | Child Poverty Among Girls Under 16 |
| Kenyans | 32.3 /100 | #190 | Fair 16.8% |
| Immigrants | Azores | 31.3 /100 | #191 | Fair 16.8% |
| Immigrants | Uganda | 31.3 /100 | #192 | Fair 16.8% |
| Aleuts | 28.7 /100 | #193 | Fair 16.9% |
| Spanish | 28.6 /100 | #194 | Fair 16.9% |
| Immigrants | Costa Rica | 25.6 /100 | #195 | Fair 17.0% |
| Celtics | 25.2 /100 | #196 | Fair 17.0% |
| Spaniards | 24.9 /100 | #197 | Fair 17.0% |
| Immigrants | Lebanon | 22.6 /100 | #198 | Fair 17.1% |
| Immigrants | Afghanistan | 22.4 /100 | #199 | Fair 17.1% |
| Immigrants | Uzbekistan | 21.5 /100 | #200 | Fair 17.1% |
| Immigrants | Kenya | 17.8 /100 | #201 | Poor 17.2% |
| Immigrants | Sierra Leone | 17.6 /100 | #202 | Poor 17.2% |
| Ugandans | 17.5 /100 | #203 | Poor 17.2% |
| Iraqis | 13.0 /100 | #204 | Poor 17.4% |