Tlingit-Haida vs Salvadoran Child Poverty Among Girls Under 16
COMPARE
Tlingit-Haida
Salvadoran
Child Poverty Among Girls Under 16
Child Poverty Among Girls Under 16 Comparison
Tlingit-Haida
Salvadorans
14.7%
CHILD POVERTY AMONG GIRLS UNDER 16
97.9/ 100
METRIC RATING
77th/ 347
METRIC RANK
19.4%
CHILD POVERTY AMONG GIRLS UNDER 16
0.2/ 100
METRIC RATING
258th/ 347
METRIC RANK
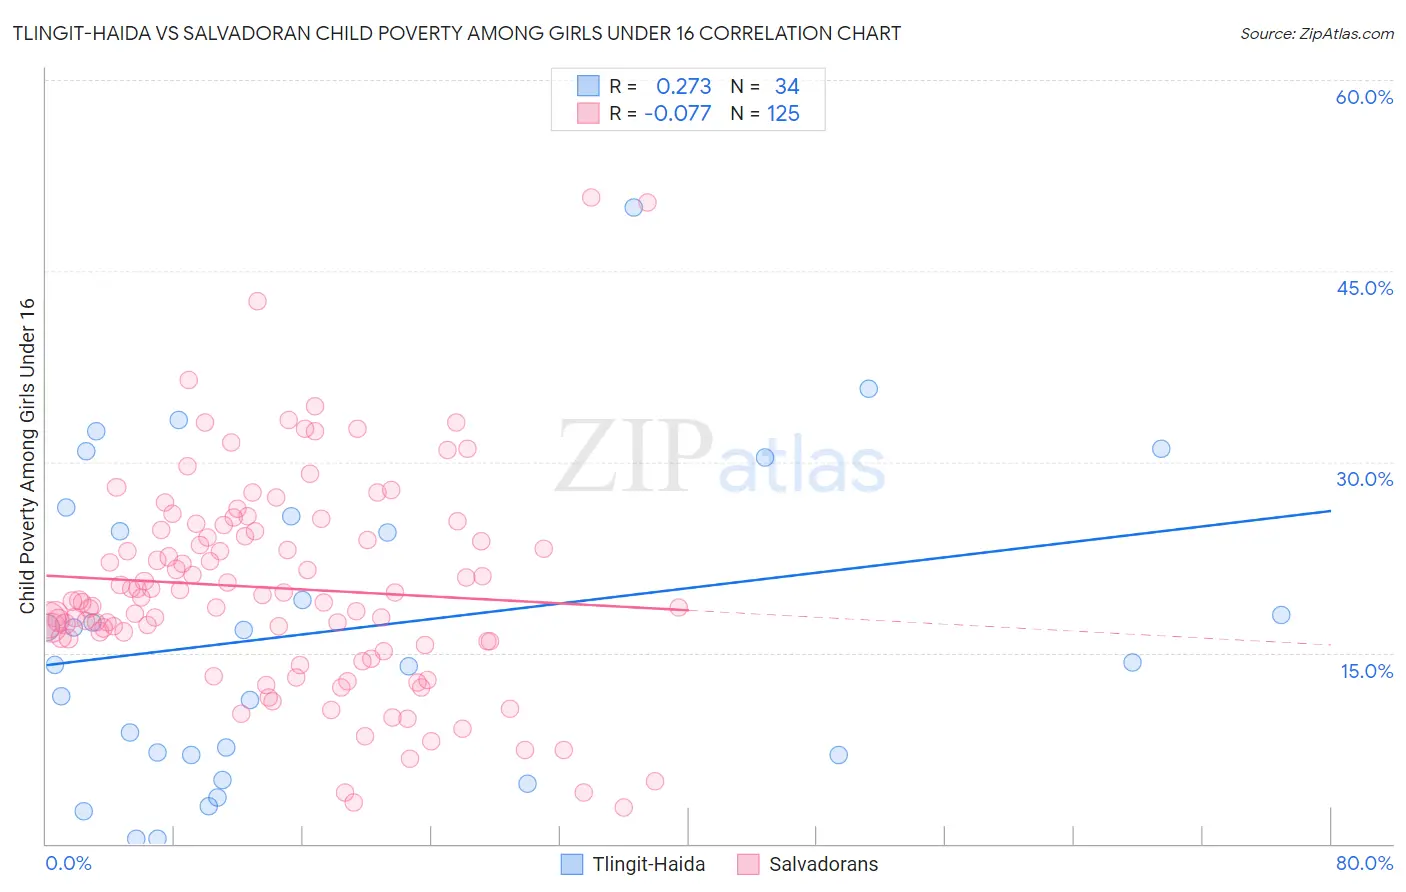
Tlingit-Haida vs Salvadoran Child Poverty Among Girls Under 16 Correlation Chart
The statistical analysis conducted on geographies consisting of 60,606,017 people shows a weak positive correlation between the proportion of Tlingit-Haida and poverty level among girls under the age of 16 in the United States with a correlation coefficient (R) of 0.273 and weighted average of 14.7%. Similarly, the statistical analysis conducted on geographies consisting of 393,655,478 people shows a slight negative correlation between the proportion of Salvadorans and poverty level among girls under the age of 16 in the United States with a correlation coefficient (R) of -0.077 and weighted average of 19.4%, a difference of 32.2%.
Child Poverty Among Girls Under 16 Correlation Summary
| Measurement | Tlingit-Haida | Salvadoran |
| Minimum | 0.43% | 2.8% |
| Maximum | 50.0% | 50.8% |
| Range | 49.6% | 48.0% |
| Mean | 16.8% | 20.1% |
| Median | 15.6% | 19.2% |
| Interquartile 25% (IQ1) | 7.0% | 15.8% |
| Interquartile 75% (IQ3) | 25.7% | 24.6% |
| Interquartile Range (IQR) | 18.7% | 8.8% |
| Standard Deviation (Sample) | 12.0% | 8.4% |
| Standard Deviation (Population) | 11.8% | 8.4% |
Similar Demographics by Child Poverty Among Girls Under 16
Demographics Similar to Tlingit-Haida by Child Poverty Among Girls Under 16
In terms of child poverty among girls under 16, the demographic groups most similar to Tlingit-Haida are Immigrants from Russia (14.7%, a difference of 0.010%), Argentinean (14.7%, a difference of 0.010%), Immigrants from Turkey (14.7%, a difference of 0.020%), Egyptian (14.7%, a difference of 0.030%), and Immigrants from Eastern Europe (14.6%, a difference of 0.16%).
| Demographics | Rating | Rank | Child Poverty Among Girls Under 16 |
| Europeans | 98.1 /100 | #70 | Exceptional 14.6% |
| Slovenes | 98.1 /100 | #71 | Exceptional 14.6% |
| Immigrants | Netherlands | 98.1 /100 | #72 | Exceptional 14.6% |
| Immigrants | Austria | 98.0 /100 | #73 | Exceptional 14.6% |
| Taiwanese | 98.0 /100 | #74 | Exceptional 14.6% |
| Immigrants | Eastern Europe | 98.0 /100 | #75 | Exceptional 14.6% |
| Immigrants | Russia | 97.9 /100 | #76 | Exceptional 14.7% |
| Tlingit-Haida | 97.9 /100 | #77 | Exceptional 14.7% |
| Argentineans | 97.9 /100 | #78 | Exceptional 14.7% |
| Immigrants | Turkey | 97.9 /100 | #79 | Exceptional 14.7% |
| Egyptians | 97.9 /100 | #80 | Exceptional 14.7% |
| Ukrainians | 97.7 /100 | #81 | Exceptional 14.7% |
| Macedonians | 97.6 /100 | #82 | Exceptional 14.7% |
| Immigrants | Italy | 97.4 /100 | #83 | Exceptional 14.8% |
| Soviet Union | 97.3 /100 | #84 | Exceptional 14.8% |
Demographics Similar to Salvadorans by Child Poverty Among Girls Under 16
In terms of child poverty among girls under 16, the demographic groups most similar to Salvadorans are Ottawa (19.4%, a difference of 0.10%), Guyanese (19.4%, a difference of 0.13%), Trinidadian and Tobagonian (19.3%, a difference of 0.37%), Immigrants from Ecuador (19.3%, a difference of 0.44%), and Immigrants from Western Africa (19.3%, a difference of 0.46%).
| Demographics | Rating | Rank | Child Poverty Among Girls Under 16 |
| Immigrants | Trinidad and Tobago | 0.3 /100 | #251 | Tragic 19.2% |
| Immigrants | Middle Africa | 0.3 /100 | #252 | Tragic 19.2% |
| Immigrants | Guyana | 0.3 /100 | #253 | Tragic 19.3% |
| Immigrants | Western Africa | 0.3 /100 | #254 | Tragic 19.3% |
| Immigrants | Ecuador | 0.3 /100 | #255 | Tragic 19.3% |
| Trinidadians and Tobagonians | 0.2 /100 | #256 | Tragic 19.3% |
| Guyanese | 0.2 /100 | #257 | Tragic 19.4% |
| Salvadorans | 0.2 /100 | #258 | Tragic 19.4% |
| Ottawa | 0.2 /100 | #259 | Tragic 19.4% |
| Mexican American Indians | 0.2 /100 | #260 | Tragic 19.5% |
| Vietnamese | 0.2 /100 | #261 | Tragic 19.5% |
| Chickasaw | 0.1 /100 | #262 | Tragic 19.6% |
| Immigrants | Burma/Myanmar | 0.1 /100 | #263 | Tragic 19.7% |
| Jamaicans | 0.1 /100 | #264 | Tragic 19.7% |
| Immigrants | Jamaica | 0.1 /100 | #265 | Tragic 19.8% |