Tlingit-Haida vs Brazilian Child Poverty Among Girls Under 16
COMPARE
Tlingit-Haida
Brazilian
Child Poverty Among Girls Under 16
Child Poverty Among Girls Under 16 Comparison
Tlingit-Haida
Brazilians
14.7%
CHILD POVERTY AMONG GIRLS UNDER 16
97.9/ 100
METRIC RATING
77th/ 347
METRIC RANK
15.4%
CHILD POVERTY AMONG GIRLS UNDER 16
89.6/ 100
METRIC RATING
133rd/ 347
METRIC RANK
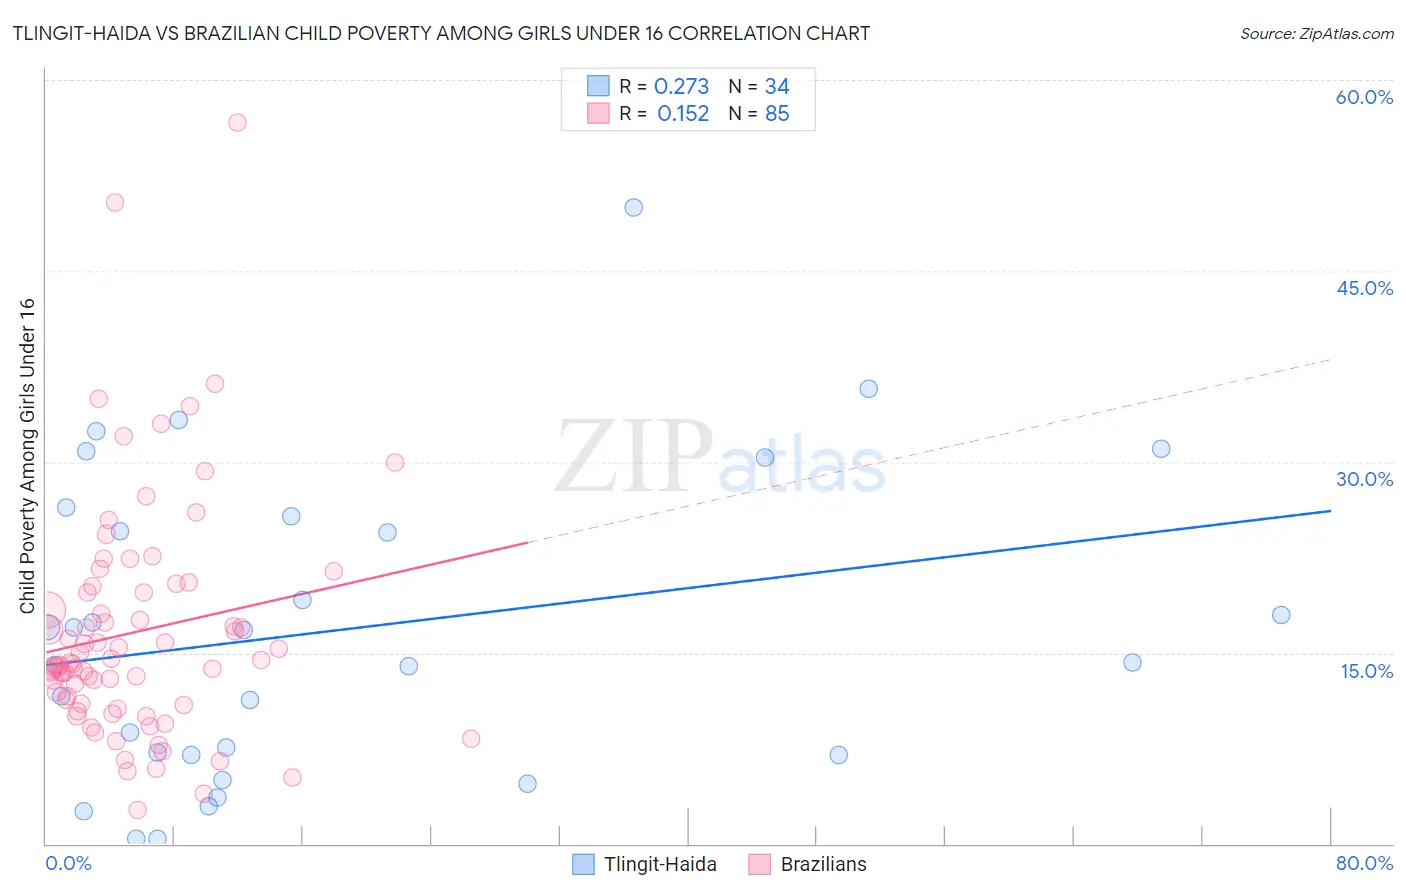
Tlingit-Haida vs Brazilian Child Poverty Among Girls Under 16 Correlation Chart
The statistical analysis conducted on geographies consisting of 60,606,017 people shows a weak positive correlation between the proportion of Tlingit-Haida and poverty level among girls under the age of 16 in the United States with a correlation coefficient (R) of 0.273 and weighted average of 14.7%. Similarly, the statistical analysis conducted on geographies consisting of 318,856,218 people shows a poor positive correlation between the proportion of Brazilians and poverty level among girls under the age of 16 in the United States with a correlation coefficient (R) of 0.152 and weighted average of 15.4%, a difference of 5.4%.
Child Poverty Among Girls Under 16 Correlation Summary
| Measurement | Tlingit-Haida | Brazilian |
| Minimum | 0.43% | 2.7% |
| Maximum | 50.0% | 56.7% |
| Range | 49.6% | 54.0% |
| Mean | 16.8% | 16.6% |
| Median | 15.6% | 14.2% |
| Interquartile 25% (IQ1) | 7.0% | 11.0% |
| Interquartile 75% (IQ3) | 25.7% | 20.0% |
| Interquartile Range (IQR) | 18.7% | 9.0% |
| Standard Deviation (Sample) | 12.0% | 9.2% |
| Standard Deviation (Population) | 11.8% | 9.2% |
Similar Demographics by Child Poverty Among Girls Under 16
Demographics Similar to Tlingit-Haida by Child Poverty Among Girls Under 16
In terms of child poverty among girls under 16, the demographic groups most similar to Tlingit-Haida are Immigrants from Russia (14.7%, a difference of 0.010%), Argentinean (14.7%, a difference of 0.010%), Immigrants from Turkey (14.7%, a difference of 0.020%), Egyptian (14.7%, a difference of 0.030%), and Immigrants from Eastern Europe (14.6%, a difference of 0.16%).
| Demographics | Rating | Rank | Child Poverty Among Girls Under 16 |
| Europeans | 98.1 /100 | #70 | Exceptional 14.6% |
| Slovenes | 98.1 /100 | #71 | Exceptional 14.6% |
| Immigrants | Netherlands | 98.1 /100 | #72 | Exceptional 14.6% |
| Immigrants | Austria | 98.0 /100 | #73 | Exceptional 14.6% |
| Taiwanese | 98.0 /100 | #74 | Exceptional 14.6% |
| Immigrants | Eastern Europe | 98.0 /100 | #75 | Exceptional 14.6% |
| Immigrants | Russia | 97.9 /100 | #76 | Exceptional 14.7% |
| Tlingit-Haida | 97.9 /100 | #77 | Exceptional 14.7% |
| Argentineans | 97.9 /100 | #78 | Exceptional 14.7% |
| Immigrants | Turkey | 97.9 /100 | #79 | Exceptional 14.7% |
| Egyptians | 97.9 /100 | #80 | Exceptional 14.7% |
| Ukrainians | 97.7 /100 | #81 | Exceptional 14.7% |
| Macedonians | 97.6 /100 | #82 | Exceptional 14.7% |
| Immigrants | Italy | 97.4 /100 | #83 | Exceptional 14.8% |
| Soviet Union | 97.3 /100 | #84 | Exceptional 14.8% |
Demographics Similar to Brazilians by Child Poverty Among Girls Under 16
In terms of child poverty among girls under 16, the demographic groups most similar to Brazilians are Mongolian (15.4%, a difference of 0.020%), Immigrants from Western Europe (15.4%, a difference of 0.13%), Puget Sound Salish (15.4%, a difference of 0.15%), Immigrants from Spain (15.5%, a difference of 0.16%), and Czechoslovakian (15.5%, a difference of 0.19%).
| Demographics | Rating | Rank | Child Poverty Among Girls Under 16 |
| Scottish | 91.0 /100 | #126 | Exceptional 15.4% |
| Immigrants | Norway | 90.8 /100 | #127 | Exceptional 15.4% |
| Albanians | 90.5 /100 | #128 | Exceptional 15.4% |
| Immigrants | South Eastern Asia | 90.5 /100 | #129 | Exceptional 15.4% |
| Puget Sound Salish | 90.1 /100 | #130 | Exceptional 15.4% |
| Immigrants | Western Europe | 90.0 /100 | #131 | Exceptional 15.4% |
| Mongolians | 89.7 /100 | #132 | Excellent 15.4% |
| Brazilians | 89.6 /100 | #133 | Excellent 15.4% |
| Immigrants | Spain | 89.1 /100 | #134 | Excellent 15.5% |
| Czechoslovakians | 89.0 /100 | #135 | Excellent 15.5% |
| Native Hawaiians | 89.0 /100 | #136 | Excellent 15.5% |
| South Africans | 88.7 /100 | #137 | Excellent 15.5% |
| Immigrants | Vietnam | 88.2 /100 | #138 | Excellent 15.5% |
| Armenians | 87.9 /100 | #139 | Excellent 15.5% |
| New Zealanders | 87.2 /100 | #140 | Excellent 15.6% |