Immigrants from Congo vs Filipino Child Poverty Among Girls Under 16
COMPARE
Immigrants from Congo
Filipino
Child Poverty Among Girls Under 16
Child Poverty Among Girls Under 16 Comparison
Immigrants from Congo
Filipinos
22.7%
CHILD POVERTY AMONG GIRLS UNDER 16
0.0/ 100
METRIC RATING
325th/ 347
METRIC RANK
11.4%
CHILD POVERTY AMONG GIRLS UNDER 16
100.0/ 100
METRIC RATING
3rd/ 347
METRIC RANK
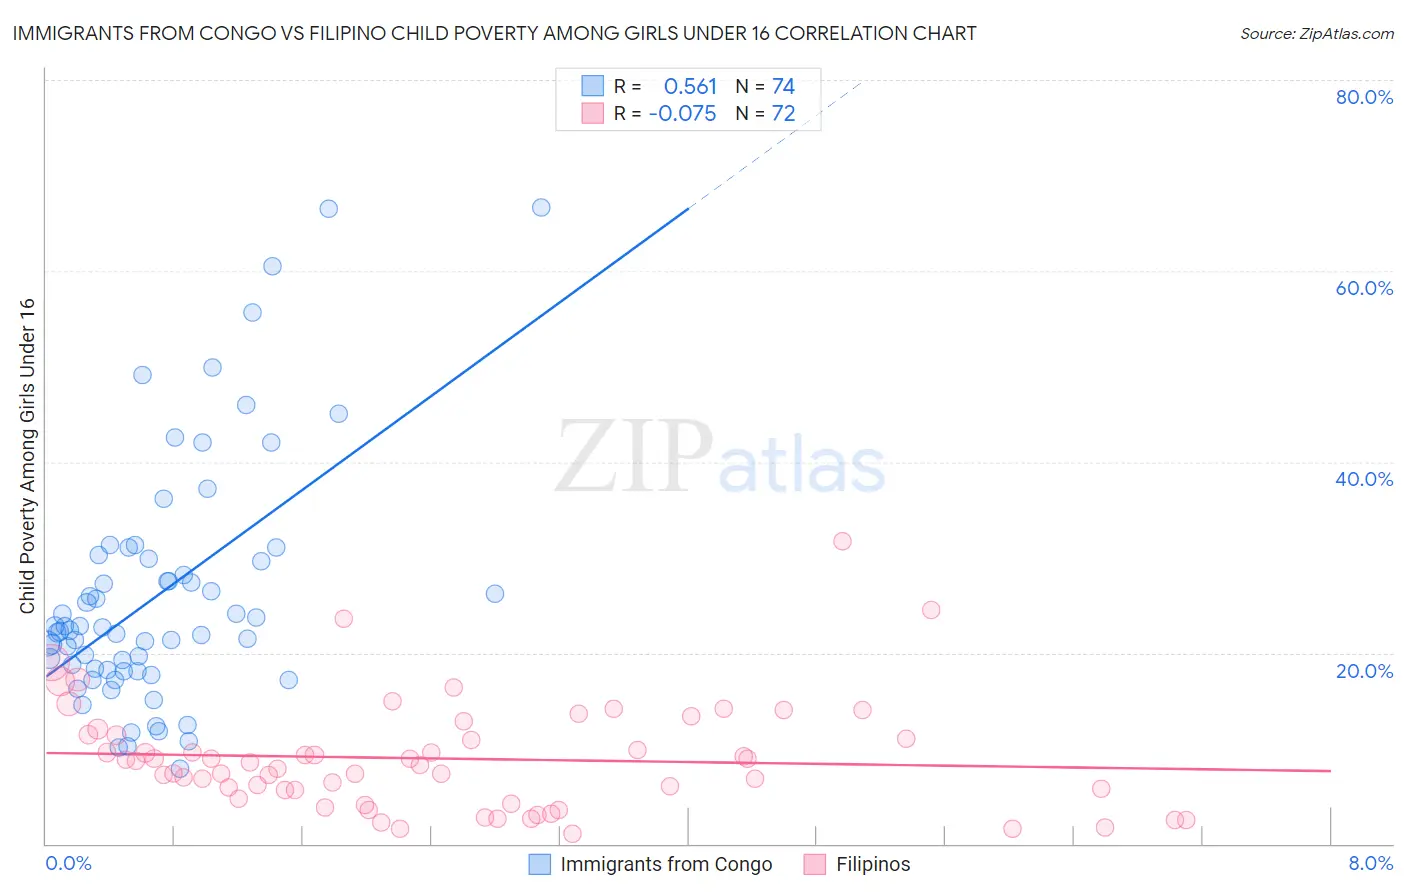
Immigrants from Congo vs Filipino Child Poverty Among Girls Under 16 Correlation Chart
The statistical analysis conducted on geographies consisting of 91,922,070 people shows a substantial positive correlation between the proportion of Immigrants from Congo and poverty level among girls under the age of 16 in the United States with a correlation coefficient (R) of 0.561 and weighted average of 22.7%. Similarly, the statistical analysis conducted on geographies consisting of 250,600,431 people shows a slight negative correlation between the proportion of Filipinos and poverty level among girls under the age of 16 in the United States with a correlation coefficient (R) of -0.075 and weighted average of 11.4%, a difference of 99.3%.
Child Poverty Among Girls Under 16 Correlation Summary
| Measurement | Immigrants from Congo | Filipino |
| Minimum | 7.9% | 0.99% |
| Maximum | 66.7% | 31.6% |
| Range | 58.8% | 30.7% |
| Mean | 26.1% | 8.9% |
| Median | 22.5% | 8.3% |
| Interquartile 25% (IQ1) | 18.2% | 5.2% |
| Interquartile 75% (IQ3) | 29.8% | 11.4% |
| Interquartile Range (IQR) | 11.7% | 6.3% |
| Standard Deviation (Sample) | 12.7% | 5.7% |
| Standard Deviation (Population) | 12.6% | 5.7% |
Similar Demographics by Child Poverty Among Girls Under 16
Demographics Similar to Immigrants from Congo by Child Poverty Among Girls Under 16
In terms of child poverty among girls under 16, the demographic groups most similar to Immigrants from Congo are Immigrants from Honduras (22.8%, a difference of 0.13%), Central American Indian (22.8%, a difference of 0.27%), Paiute (22.6%, a difference of 0.50%), Cajun (22.6%, a difference of 0.79%), and Yakama (22.6%, a difference of 0.80%).
| Demographics | Rating | Rank | Child Poverty Among Girls Under 16 |
| Immigrants | Dominica | 0.0 /100 | #318 | Tragic 22.1% |
| U.S. Virgin Islanders | 0.0 /100 | #319 | Tragic 22.1% |
| Hondurans | 0.0 /100 | #320 | Tragic 22.2% |
| Colville | 0.0 /100 | #321 | Tragic 22.5% |
| Yakama | 0.0 /100 | #322 | Tragic 22.6% |
| Cajuns | 0.0 /100 | #323 | Tragic 22.6% |
| Paiute | 0.0 /100 | #324 | Tragic 22.6% |
| Immigrants | Congo | 0.0 /100 | #325 | Tragic 22.7% |
| Immigrants | Honduras | 0.0 /100 | #326 | Tragic 22.8% |
| Central American Indians | 0.0 /100 | #327 | Tragic 22.8% |
| Dominicans | 0.0 /100 | #328 | Tragic 23.7% |
| Kiowa | 0.0 /100 | #329 | Tragic 23.7% |
| Immigrants | Dominican Republic | 0.0 /100 | #330 | Tragic 23.8% |
| Apache | 0.0 /100 | #331 | Tragic 23.8% |
| Natives/Alaskans | 0.0 /100 | #332 | Tragic 24.0% |
Demographics Similar to Filipinos by Child Poverty Among Girls Under 16
In terms of child poverty among girls under 16, the demographic groups most similar to Filipinos are Tsimshian (11.5%, a difference of 0.52%), Immigrants from Taiwan (11.3%, a difference of 0.87%), Immigrants from India (11.0%, a difference of 3.5%), Thai (11.8%, a difference of 3.6%), and Immigrants from Hong Kong (12.3%, a difference of 8.0%).
| Demographics | Rating | Rank | Child Poverty Among Girls Under 16 |
| Immigrants | India | 100.0 /100 | #1 | Exceptional 11.0% |
| Immigrants | Taiwan | 100.0 /100 | #2 | Exceptional 11.3% |
| Filipinos | 100.0 /100 | #3 | Exceptional 11.4% |
| Tsimshian | 100.0 /100 | #4 | Exceptional 11.5% |
| Thais | 100.0 /100 | #5 | Exceptional 11.8% |
| Immigrants | Hong Kong | 100.0 /100 | #6 | Exceptional 12.3% |
| Chinese | 100.0 /100 | #7 | Exceptional 12.3% |
| Iranians | 100.0 /100 | #8 | Exceptional 12.4% |
| Immigrants | Singapore | 100.0 /100 | #9 | Exceptional 12.5% |
| Immigrants | Iran | 100.0 /100 | #10 | Exceptional 12.6% |
| Immigrants | South Central Asia | 100.0 /100 | #11 | Exceptional 12.7% |
| Bhutanese | 100.0 /100 | #12 | Exceptional 12.7% |
| Immigrants | Ireland | 99.9 /100 | #13 | Exceptional 12.9% |
| Burmese | 99.9 /100 | #14 | Exceptional 13.0% |
| Okinawans | 99.9 /100 | #15 | Exceptional 13.0% |