Tlingit-Haida vs Yaqui Single Female Poverty
COMPARE
Tlingit-Haida
Yaqui
Single Female Poverty
Single Female Poverty Comparison
Tlingit-Haida
Yaqui
21.9%
SINGLE FEMALE POVERTY
5.4/ 100
METRIC RATING
229th/ 347
METRIC RANK
24.9%
SINGLE FEMALE POVERTY
0.0/ 100
METRIC RATING
298th/ 347
METRIC RANK
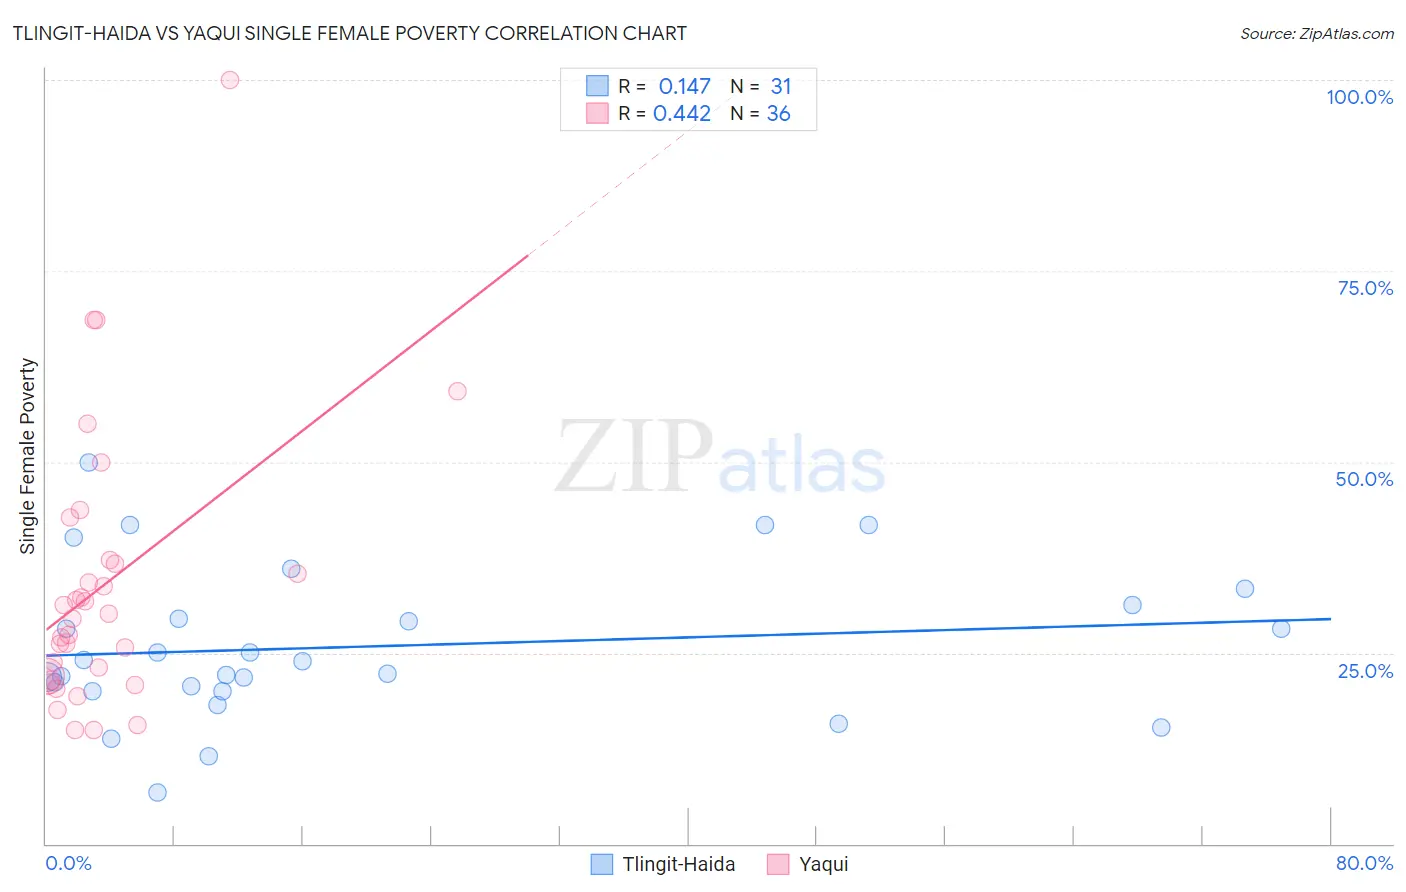
Tlingit-Haida vs Yaqui Single Female Poverty Correlation Chart
The statistical analysis conducted on geographies consisting of 60,536,912 people shows a poor positive correlation between the proportion of Tlingit-Haida and poverty level among single females in the United States with a correlation coefficient (R) of 0.147 and weighted average of 21.9%. Similarly, the statistical analysis conducted on geographies consisting of 107,224,239 people shows a moderate positive correlation between the proportion of Yaqui and poverty level among single females in the United States with a correlation coefficient (R) of 0.442 and weighted average of 24.9%, a difference of 13.3%.
Single Female Poverty Correlation Summary
| Measurement | Tlingit-Haida | Yaqui |
| Minimum | 6.7% | 14.9% |
| Maximum | 50.0% | 100.0% |
| Range | 43.3% | 85.1% |
| Mean | 25.9% | 33.8% |
| Median | 23.9% | 29.7% |
| Interquartile 25% (IQ1) | 20.0% | 21.7% |
| Interquartile 75% (IQ3) | 31.2% | 37.0% |
| Interquartile Range (IQR) | 11.2% | 15.3% |
| Standard Deviation (Sample) | 9.9% | 17.9% |
| Standard Deviation (Population) | 9.8% | 17.7% |
Similar Demographics by Single Female Poverty
Demographics Similar to Tlingit-Haida by Single Female Poverty
In terms of single female poverty, the demographic groups most similar to Tlingit-Haida are Immigrants from Western Africa (22.0%, a difference of 0.020%), Salvadoran (21.9%, a difference of 0.030%), Welsh (22.0%, a difference of 0.11%), Immigrants from Ghana (21.9%, a difference of 0.12%), and Immigrants from Thailand (22.0%, a difference of 0.12%).
| Demographics | Rating | Rank | Single Female Poverty |
| Immigrants | Eritrea | 7.9 /100 | #222 | Tragic 21.8% |
| Scottish | 7.3 /100 | #223 | Tragic 21.8% |
| Barbadians | 7.2 /100 | #224 | Tragic 21.8% |
| English | 6.4 /100 | #225 | Tragic 21.9% |
| Immigrants | Portugal | 5.8 /100 | #226 | Tragic 21.9% |
| Immigrants | Ghana | 5.8 /100 | #227 | Tragic 21.9% |
| Salvadorans | 5.5 /100 | #228 | Tragic 21.9% |
| Tlingit-Haida | 5.4 /100 | #229 | Tragic 21.9% |
| Immigrants | Western Africa | 5.3 /100 | #230 | Tragic 22.0% |
| Welsh | 5.0 /100 | #231 | Tragic 22.0% |
| Immigrants | Thailand | 5.0 /100 | #232 | Tragic 22.0% |
| Spaniards | 4.7 /100 | #233 | Tragic 22.0% |
| Spanish | 4.7 /100 | #234 | Tragic 22.0% |
| Dutch | 4.6 /100 | #235 | Tragic 22.0% |
| Immigrants | Ecuador | 4.2 /100 | #236 | Tragic 22.0% |
Demographics Similar to Yaqui by Single Female Poverty
In terms of single female poverty, the demographic groups most similar to Yaqui are Immigrants from Central America (24.8%, a difference of 0.19%), African (24.8%, a difference of 0.48%), Mexican (25.0%, a difference of 0.67%), Blackfeet (25.1%, a difference of 0.74%), and Honduran (25.1%, a difference of 0.92%).
| Demographics | Rating | Rank | Single Female Poverty |
| Osage | 0.0 /100 | #291 | Tragic 24.4% |
| Alsatians | 0.0 /100 | #292 | Tragic 24.5% |
| Americans | 0.0 /100 | #293 | Tragic 24.5% |
| French American Indians | 0.0 /100 | #294 | Tragic 24.6% |
| Hispanics or Latinos | 0.0 /100 | #295 | Tragic 24.6% |
| Africans | 0.0 /100 | #296 | Tragic 24.8% |
| Immigrants | Central America | 0.0 /100 | #297 | Tragic 24.8% |
| Yaqui | 0.0 /100 | #298 | Tragic 24.9% |
| Mexicans | 0.0 /100 | #299 | Tragic 25.0% |
| Blackfeet | 0.0 /100 | #300 | Tragic 25.1% |
| Hondurans | 0.0 /100 | #301 | Tragic 25.1% |
| Shoshone | 0.0 /100 | #302 | Tragic 25.1% |
| Somalis | 0.0 /100 | #303 | Tragic 25.2% |
| Immigrants | Congo | 0.0 /100 | #304 | Tragic 25.3% |
| Immigrants | Dominican Republic | 0.0 /100 | #305 | Tragic 25.3% |