Immigrants from Vietnam vs Bangladeshi Single Mother Poverty
COMPARE
Immigrants from Vietnam
Bangladeshi
Single Mother Poverty
Single Mother Poverty Comparison
Immigrants from Vietnam
Bangladeshis
26.7%
SINGLE MOTHER POVERTY
99.9/ 100
METRIC RATING
40th/ 347
METRIC RANK
31.7%
SINGLE MOTHER POVERTY
0.1/ 100
METRIC RATING
274th/ 347
METRIC RANK
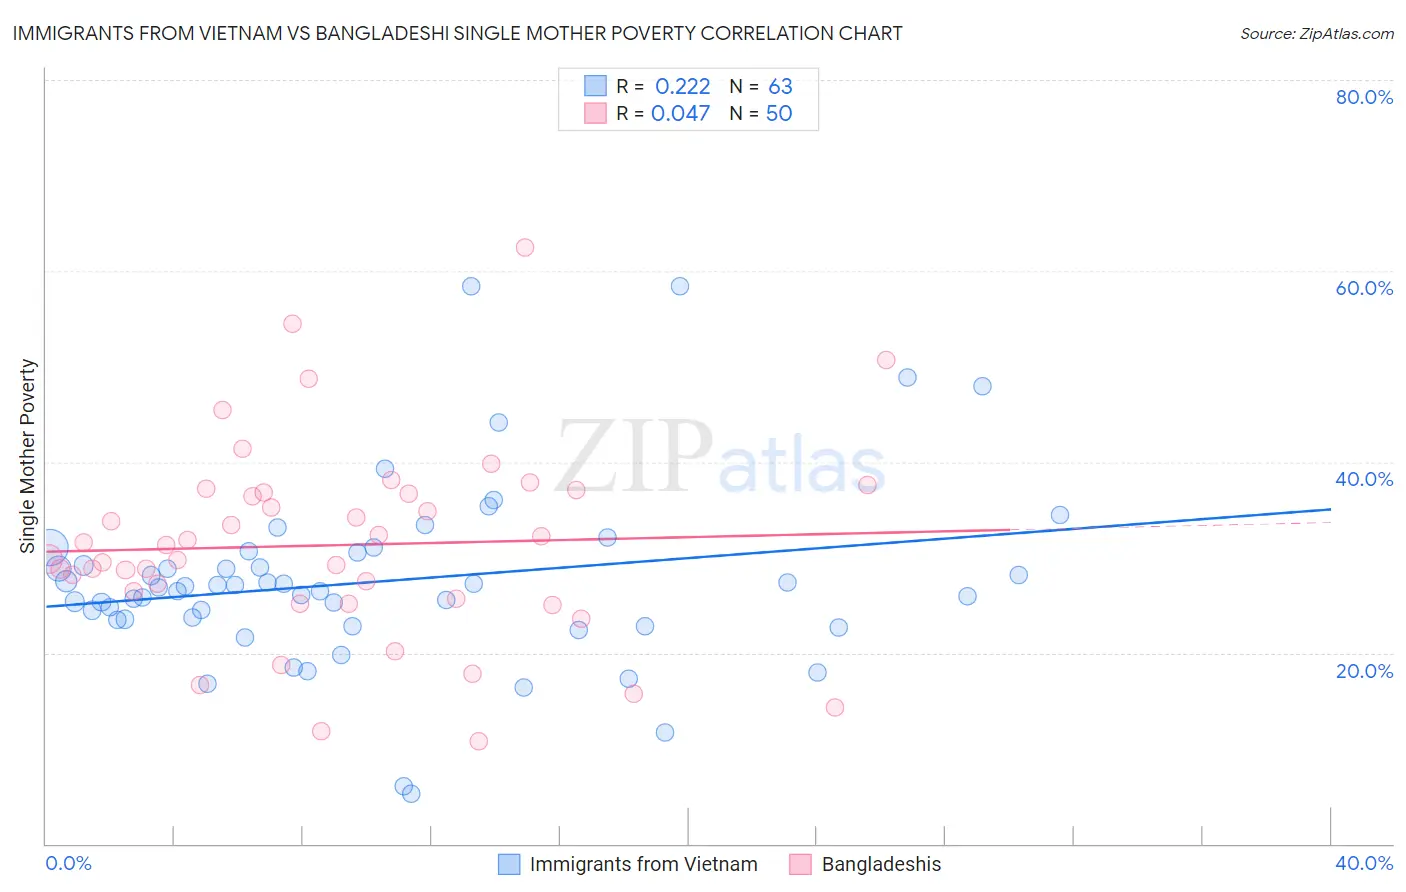
Immigrants from Vietnam vs Bangladeshi Single Mother Poverty Correlation Chart
The statistical analysis conducted on geographies consisting of 395,889,190 people shows a weak positive correlation between the proportion of Immigrants from Vietnam and poverty level among single mothers in the United States with a correlation coefficient (R) of 0.222 and weighted average of 26.7%. Similarly, the statistical analysis conducted on geographies consisting of 140,162,817 people shows no correlation between the proportion of Bangladeshis and poverty level among single mothers in the United States with a correlation coefficient (R) of 0.047 and weighted average of 31.7%, a difference of 18.7%.
Single Mother Poverty Correlation Summary
| Measurement | Immigrants from Vietnam | Bangladeshi |
| Minimum | 5.2% | 10.8% |
| Maximum | 58.3% | 62.5% |
| Range | 53.1% | 51.7% |
| Mean | 27.5% | 31.3% |
| Median | 26.8% | 30.5% |
| Interquartile 25% (IQ1) | 23.5% | 25.7% |
| Interquartile 75% (IQ3) | 30.5% | 36.8% |
| Interquartile Range (IQR) | 7.0% | 11.1% |
| Standard Deviation (Sample) | 9.5% | 10.3% |
| Standard Deviation (Population) | 9.4% | 10.2% |
Similar Demographics by Single Mother Poverty
Demographics Similar to Immigrants from Vietnam by Single Mother Poverty
In terms of single mother poverty, the demographic groups most similar to Immigrants from Vietnam are Immigrants from Greece (26.7%, a difference of 0.070%), Sri Lankan (26.7%, a difference of 0.090%), Armenian (26.8%, a difference of 0.31%), Tsimshian (26.8%, a difference of 0.39%), and Immigrants from Fiji (26.6%, a difference of 0.43%).
| Demographics | Rating | Rank | Single Mother Poverty |
| Bulgarians | 99.9 /100 | #33 | Exceptional 26.5% |
| Immigrants | Indonesia | 99.9 /100 | #34 | Exceptional 26.6% |
| Maltese | 99.9 /100 | #35 | Exceptional 26.6% |
| Okinawans | 99.9 /100 | #36 | Exceptional 26.6% |
| Immigrants | Israel | 99.9 /100 | #37 | Exceptional 26.6% |
| Immigrants | Fiji | 99.9 /100 | #38 | Exceptional 26.6% |
| Sri Lankans | 99.9 /100 | #39 | Exceptional 26.7% |
| Immigrants | Vietnam | 99.9 /100 | #40 | Exceptional 26.7% |
| Immigrants | Greece | 99.9 /100 | #41 | Exceptional 26.7% |
| Armenians | 99.9 /100 | #42 | Exceptional 26.8% |
| Tsimshian | 99.9 /100 | #43 | Exceptional 26.8% |
| Immigrants | Sierra Leone | 99.9 /100 | #44 | Exceptional 26.9% |
| Latvians | 99.9 /100 | #45 | Exceptional 26.9% |
| Immigrants | Serbia | 99.9 /100 | #46 | Exceptional 26.9% |
| Egyptians | 99.8 /100 | #47 | Exceptional 26.9% |
Demographics Similar to Bangladeshis by Single Mother Poverty
In terms of single mother poverty, the demographic groups most similar to Bangladeshis are Central American (31.8%, a difference of 0.19%), Fijian (31.6%, a difference of 0.23%), Delaware (31.8%, a difference of 0.35%), Immigrants from Micronesia (31.6%, a difference of 0.46%), and Immigrants from Cabo Verde (31.6%, a difference of 0.48%).
| Demographics | Rating | Rank | Single Mother Poverty |
| Immigrants | Belize | 0.2 /100 | #267 | Tragic 31.4% |
| Immigrants | Senegal | 0.1 /100 | #268 | Tragic 31.5% |
| Scotch-Irish | 0.1 /100 | #269 | Tragic 31.5% |
| British West Indians | 0.1 /100 | #270 | Tragic 31.5% |
| Immigrants | Cabo Verde | 0.1 /100 | #271 | Tragic 31.6% |
| Immigrants | Micronesia | 0.1 /100 | #272 | Tragic 31.6% |
| Fijians | 0.1 /100 | #273 | Tragic 31.6% |
| Bangladeshis | 0.1 /100 | #274 | Tragic 31.7% |
| Central Americans | 0.1 /100 | #275 | Tragic 31.8% |
| Delaware | 0.0 /100 | #276 | Tragic 31.8% |
| Mexican American Indians | 0.0 /100 | #277 | Tragic 31.9% |
| Immigrants | Zaire | 0.0 /100 | #278 | Tragic 32.0% |
| Marshallese | 0.0 /100 | #279 | Tragic 32.1% |
| Immigrants | Nonimmigrants | 0.0 /100 | #280 | Tragic 32.2% |
| Cree | 0.0 /100 | #281 | Tragic 32.2% |