Iroquois vs Bangladeshi Single Mother Poverty
COMPARE
Iroquois
Bangladeshi
Single Mother Poverty
Single Mother Poverty Comparison
Iroquois
Bangladeshis
34.8%
SINGLE MOTHER POVERTY
0.0/ 100
METRIC RATING
320th/ 347
METRIC RANK
31.7%
SINGLE MOTHER POVERTY
0.1/ 100
METRIC RATING
274th/ 347
METRIC RANK
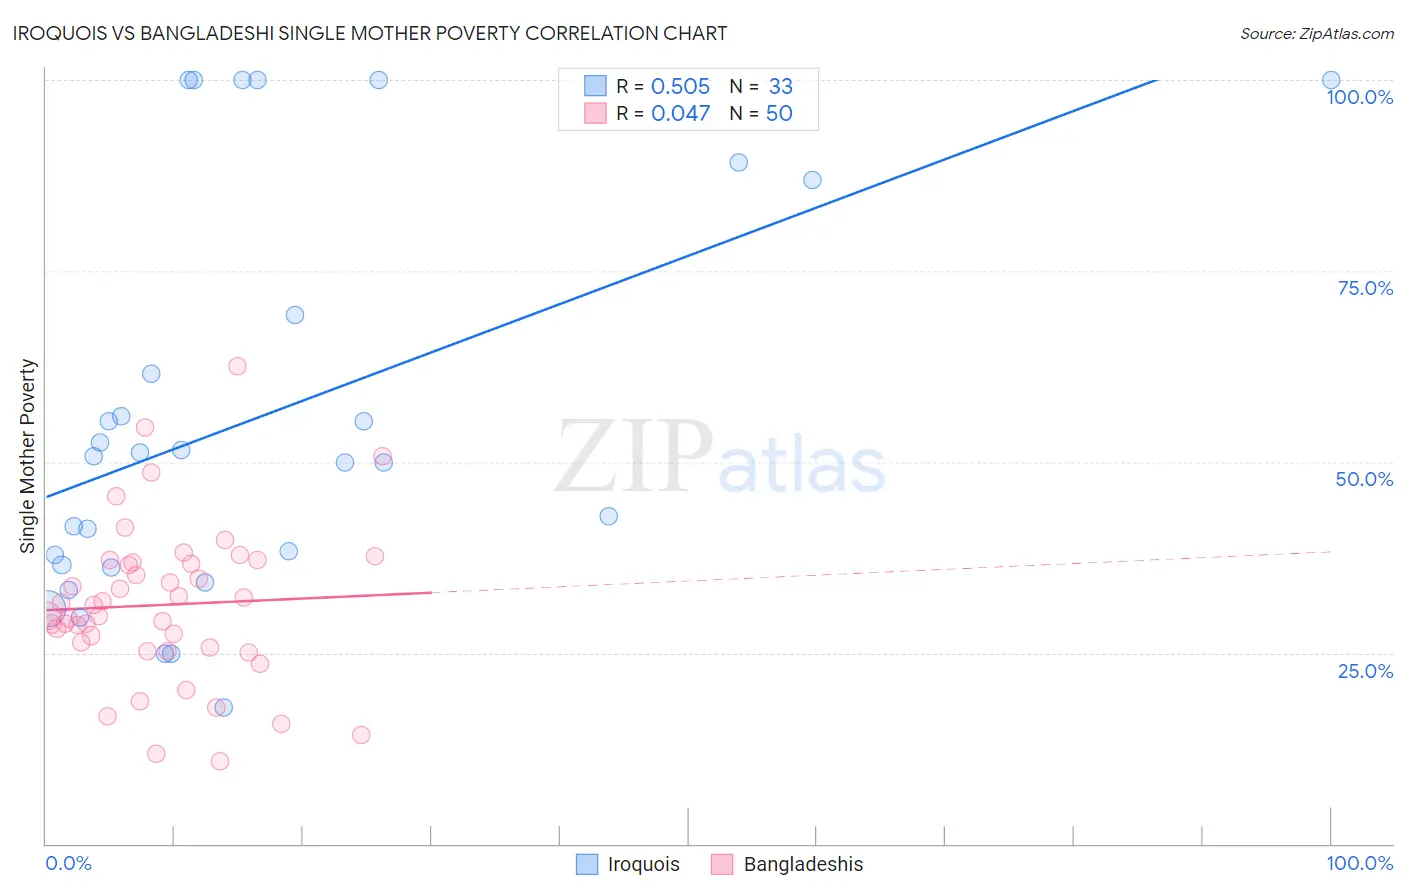
Iroquois vs Bangladeshi Single Mother Poverty Correlation Chart
The statistical analysis conducted on geographies consisting of 204,844,819 people shows a substantial positive correlation between the proportion of Iroquois and poverty level among single mothers in the United States with a correlation coefficient (R) of 0.505 and weighted average of 34.8%. Similarly, the statistical analysis conducted on geographies consisting of 140,162,817 people shows no correlation between the proportion of Bangladeshis and poverty level among single mothers in the United States with a correlation coefficient (R) of 0.047 and weighted average of 31.7%, a difference of 9.8%.
Single Mother Poverty Correlation Summary
| Measurement | Iroquois | Bangladeshi |
| Minimum | 17.9% | 10.8% |
| Maximum | 100.0% | 62.5% |
| Range | 82.1% | 51.7% |
| Mean | 56.0% | 31.3% |
| Median | 50.8% | 30.5% |
| Interquartile 25% (IQ1) | 36.4% | 25.7% |
| Interquartile 75% (IQ3) | 78.1% | 36.8% |
| Interquartile Range (IQR) | 41.7% | 11.1% |
| Standard Deviation (Sample) | 26.1% | 10.3% |
| Standard Deviation (Population) | 25.7% | 10.2% |
Similar Demographics by Single Mother Poverty
Demographics Similar to Iroquois by Single Mother Poverty
In terms of single mother poverty, the demographic groups most similar to Iroquois are Chippewa (34.8%, a difference of 0.24%), Immigrants from Honduras (34.7%, a difference of 0.39%), Paiute (35.1%, a difference of 0.87%), Cherokee (34.5%, a difference of 0.91%), and Dominican (34.5%, a difference of 1.0%).
| Demographics | Rating | Rank | Single Mother Poverty |
| Immigrants | Dominican Republic | 0.0 /100 | #313 | Tragic 34.4% |
| Chickasaw | 0.0 /100 | #314 | Tragic 34.4% |
| Hopi | 0.0 /100 | #315 | Tragic 34.5% |
| Dominicans | 0.0 /100 | #316 | Tragic 34.5% |
| Cherokee | 0.0 /100 | #317 | Tragic 34.5% |
| Immigrants | Honduras | 0.0 /100 | #318 | Tragic 34.7% |
| Chippewa | 0.0 /100 | #319 | Tragic 34.8% |
| Iroquois | 0.0 /100 | #320 | Tragic 34.8% |
| Paiute | 0.0 /100 | #321 | Tragic 35.1% |
| Blacks/African Americans | 0.0 /100 | #322 | Tragic 35.2% |
| Kiowa | 0.0 /100 | #323 | Tragic 35.5% |
| Ottawa | 0.0 /100 | #324 | Tragic 35.5% |
| Ute | 0.0 /100 | #325 | Tragic 35.7% |
| Seminole | 0.0 /100 | #326 | Tragic 35.8% |
| Yakama | 0.0 /100 | #327 | Tragic 36.4% |
Demographics Similar to Bangladeshis by Single Mother Poverty
In terms of single mother poverty, the demographic groups most similar to Bangladeshis are Central American (31.8%, a difference of 0.19%), Fijian (31.6%, a difference of 0.23%), Delaware (31.8%, a difference of 0.35%), Immigrants from Micronesia (31.6%, a difference of 0.46%), and Immigrants from Cabo Verde (31.6%, a difference of 0.48%).
| Demographics | Rating | Rank | Single Mother Poverty |
| Immigrants | Belize | 0.2 /100 | #267 | Tragic 31.4% |
| Immigrants | Senegal | 0.1 /100 | #268 | Tragic 31.5% |
| Scotch-Irish | 0.1 /100 | #269 | Tragic 31.5% |
| British West Indians | 0.1 /100 | #270 | Tragic 31.5% |
| Immigrants | Cabo Verde | 0.1 /100 | #271 | Tragic 31.6% |
| Immigrants | Micronesia | 0.1 /100 | #272 | Tragic 31.6% |
| Fijians | 0.1 /100 | #273 | Tragic 31.6% |
| Bangladeshis | 0.1 /100 | #274 | Tragic 31.7% |
| Central Americans | 0.1 /100 | #275 | Tragic 31.8% |
| Delaware | 0.0 /100 | #276 | Tragic 31.8% |
| Mexican American Indians | 0.0 /100 | #277 | Tragic 31.9% |
| Immigrants | Zaire | 0.0 /100 | #278 | Tragic 32.0% |
| Marshallese | 0.0 /100 | #279 | Tragic 32.1% |
| Immigrants | Nonimmigrants | 0.0 /100 | #280 | Tragic 32.2% |
| Cree | 0.0 /100 | #281 | Tragic 32.2% |