Taiwanese vs Venezuelan Hearing Disability
COMPARE
Taiwanese
Venezuelan
Hearing Disability
Hearing Disability Comparison
Taiwanese
Venezuelans
2.8%
HEARING DISABILITY
94.8/ 100
METRIC RATING
102nd/ 347
METRIC RANK
2.6%
HEARING DISABILITY
99.4/ 100
METRIC RATING
45th/ 347
METRIC RANK
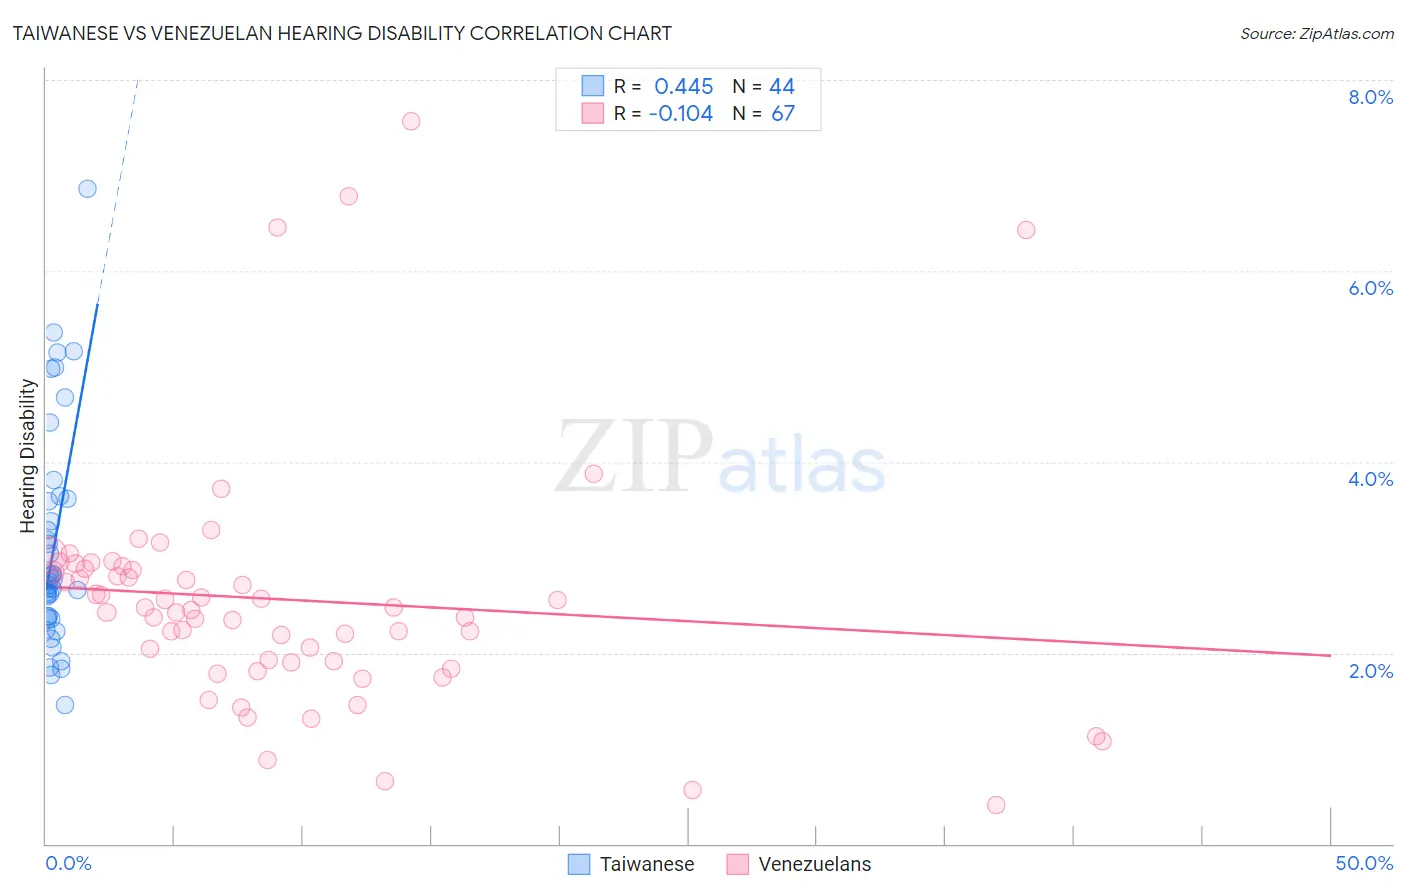
Taiwanese vs Venezuelan Hearing Disability Correlation Chart
The statistical analysis conducted on geographies consisting of 31,724,936 people shows a moderate positive correlation between the proportion of Taiwanese and percentage of population with hearing disability in the United States with a correlation coefficient (R) of 0.445 and weighted average of 2.8%. Similarly, the statistical analysis conducted on geographies consisting of 306,240,501 people shows a poor negative correlation between the proportion of Venezuelans and percentage of population with hearing disability in the United States with a correlation coefficient (R) of -0.104 and weighted average of 2.6%, a difference of 5.6%.
Hearing Disability Correlation Summary
| Measurement | Taiwanese | Venezuelan |
| Minimum | 1.5% | 0.40% |
| Maximum | 6.9% | 7.6% |
| Range | 5.4% | 7.2% |
| Mean | 3.1% | 2.6% |
| Median | 2.8% | 2.4% |
| Interquartile 25% (IQ1) | 2.4% | 1.9% |
| Interquartile 75% (IQ3) | 3.6% | 2.9% |
| Interquartile Range (IQR) | 1.2% | 0.97% |
| Standard Deviation (Sample) | 1.2% | 1.3% |
| Standard Deviation (Population) | 1.1% | 1.3% |
Similar Demographics by Hearing Disability
Demographics Similar to Taiwanese by Hearing Disability
In terms of hearing disability, the demographic groups most similar to Taiwanese are Immigrants from Spain (2.8%, a difference of 0.010%), Immigrants from Indonesia (2.8%, a difference of 0.050%), Immigrants from Eastern Africa (2.8%, a difference of 0.070%), Immigrants from Guatemala (2.8%, a difference of 0.12%), and Immigrants from Honduras (2.8%, a difference of 0.16%).
| Demographics | Rating | Rank | Hearing Disability |
| Israelis | 95.9 /100 | #95 | Exceptional 2.8% |
| Immigrants | Somalia | 95.5 /100 | #96 | Exceptional 2.8% |
| Immigrants | Afghanistan | 95.3 /100 | #97 | Exceptional 2.8% |
| Immigrants | Honduras | 95.1 /100 | #98 | Exceptional 2.8% |
| Immigrants | Guatemala | 95.1 /100 | #99 | Exceptional 2.8% |
| Immigrants | Eastern Africa | 95.0 /100 | #100 | Exceptional 2.8% |
| Immigrants | Spain | 94.9 /100 | #101 | Exceptional 2.8% |
| Taiwanese | 94.8 /100 | #102 | Exceptional 2.8% |
| Immigrants | Indonesia | 94.7 /100 | #103 | Exceptional 2.8% |
| Burmese | 94.2 /100 | #104 | Exceptional 2.8% |
| Moroccans | 93.9 /100 | #105 | Exceptional 2.8% |
| Hondurans | 93.4 /100 | #106 | Exceptional 2.8% |
| Immigrants | Chile | 93.4 /100 | #107 | Exceptional 2.8% |
| Guatemalans | 93.2 /100 | #108 | Exceptional 2.8% |
| Turks | 93.0 /100 | #109 | Exceptional 2.8% |
Demographics Similar to Venezuelans by Hearing Disability
In terms of hearing disability, the demographic groups most similar to Venezuelans are Nigerian (2.6%, a difference of 0.020%), Immigrants from Dominica (2.6%, a difference of 0.10%), West Indian (2.6%, a difference of 0.25%), Senegalese (2.6%, a difference of 0.25%), and Immigrants from Israel (2.6%, a difference of 0.25%).
| Demographics | Rating | Rank | Hearing Disability |
| Immigrants | Jamaica | 99.5 /100 | #38 | Exceptional 2.6% |
| Immigrants | China | 99.5 /100 | #39 | Exceptional 2.6% |
| Haitians | 99.5 /100 | #40 | Exceptional 2.6% |
| Immigrants | Taiwan | 99.4 /100 | #41 | Exceptional 2.6% |
| West Indians | 99.4 /100 | #42 | Exceptional 2.6% |
| Senegalese | 99.4 /100 | #43 | Exceptional 2.6% |
| Nigerians | 99.4 /100 | #44 | Exceptional 2.6% |
| Venezuelans | 99.4 /100 | #45 | Exceptional 2.6% |
| Immigrants | Dominica | 99.3 /100 | #46 | Exceptional 2.6% |
| Immigrants | Israel | 99.3 /100 | #47 | Exceptional 2.6% |
| Immigrants | Singapore | 99.3 /100 | #48 | Exceptional 2.6% |
| Immigrants | South America | 99.2 /100 | #49 | Exceptional 2.7% |
| Paraguayans | 99.2 /100 | #50 | Exceptional 2.7% |
| Immigrants | Hong Kong | 99.2 /100 | #51 | Exceptional 2.7% |
| Jamaicans | 99.0 /100 | #52 | Exceptional 2.7% |