Immigrants from Guyana vs Venezuelan Single Female Poverty
COMPARE
Immigrants from Guyana
Venezuelan
Single Female Poverty
Single Female Poverty Comparison
Immigrants from Guyana
Venezuelans
21.0%
SINGLE FEMALE POVERTY
50.6/ 100
METRIC RATING
173rd/ 347
METRIC RANK
20.4%
SINGLE FEMALE POVERTY
85.5/ 100
METRIC RATING
146th/ 347
METRIC RANK
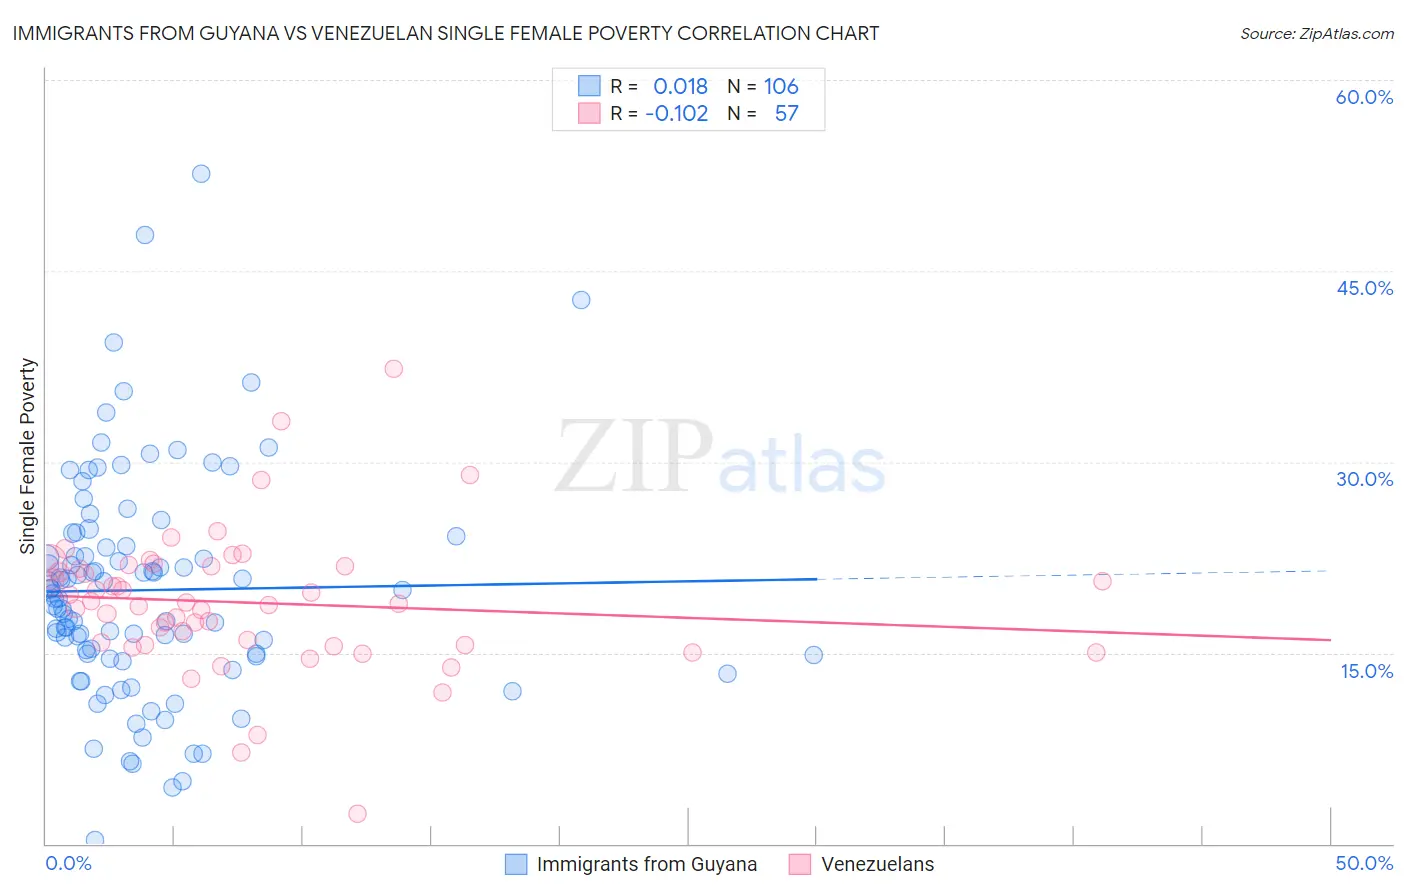
Immigrants from Guyana vs Venezuelan Single Female Poverty Correlation Chart
The statistical analysis conducted on geographies consisting of 182,103,781 people shows no correlation between the proportion of Immigrants from Guyana and poverty level among single females in the United States with a correlation coefficient (R) of 0.018 and weighted average of 21.0%. Similarly, the statistical analysis conducted on geographies consisting of 303,310,735 people shows a poor negative correlation between the proportion of Venezuelans and poverty level among single females in the United States with a correlation coefficient (R) of -0.102 and weighted average of 20.4%, a difference of 2.8%.
Single Female Poverty Correlation Summary
| Measurement | Immigrants from Guyana | Venezuelan |
| Minimum | 0.34% | 2.3% |
| Maximum | 52.6% | 37.3% |
| Range | 52.3% | 35.0% |
| Mean | 19.9% | 18.9% |
| Median | 19.5% | 18.8% |
| Interquartile 25% (IQ1) | 14.8% | 15.6% |
| Interquartile 75% (IQ3) | 23.4% | 21.8% |
| Interquartile Range (IQR) | 8.6% | 6.2% |
| Standard Deviation (Sample) | 8.8% | 5.6% |
| Standard Deviation (Population) | 8.8% | 5.5% |
Similar Demographics by Single Female Poverty
Demographics Similar to Immigrants from Guyana by Single Female Poverty
In terms of single female poverty, the demographic groups most similar to Immigrants from Guyana are Cuban (21.0%, a difference of 0.040%), Guyanese (21.0%, a difference of 0.090%), Moroccan (21.0%, a difference of 0.14%), New Zealander (21.0%, a difference of 0.16%), and Czech (21.0%, a difference of 0.24%).
| Demographics | Rating | Rank | Single Female Poverty |
| Norwegians | 63.0 /100 | #166 | Good 20.8% |
| Immigrants | Norway | 63.0 /100 | #167 | Good 20.8% |
| Immigrants | Costa Rica | 61.5 /100 | #168 | Good 20.9% |
| Immigrants | Trinidad and Tobago | 56.3 /100 | #169 | Average 20.9% |
| New Zealanders | 53.2 /100 | #170 | Average 21.0% |
| Moroccans | 52.8 /100 | #171 | Average 21.0% |
| Guyanese | 52.0 /100 | #172 | Average 21.0% |
| Immigrants | Guyana | 50.6 /100 | #173 | Average 21.0% |
| Cubans | 50.0 /100 | #174 | Average 21.0% |
| Czechs | 46.8 /100 | #175 | Average 21.0% |
| Canadians | 45.4 /100 | #176 | Average 21.1% |
| Scandinavians | 45.2 /100 | #177 | Average 21.1% |
| Immigrants | Bosnia and Herzegovina | 44.9 /100 | #178 | Average 21.1% |
| British | 42.9 /100 | #179 | Average 21.1% |
| Spanish American Indians | 42.5 /100 | #180 | Average 21.1% |
Demographics Similar to Venezuelans by Single Female Poverty
In terms of single female poverty, the demographic groups most similar to Venezuelans are Austrian (20.4%, a difference of 0.030%), South African (20.4%, a difference of 0.030%), Luxembourger (20.4%, a difference of 0.080%), Immigrants from Uzbekistan (20.3%, a difference of 0.39%), and Australian (20.3%, a difference of 0.40%).
| Demographics | Rating | Rank | Single Female Poverty |
| Immigrants | Kuwait | 90.4 /100 | #139 | Exceptional 20.3% |
| Syrians | 90.4 /100 | #140 | Exceptional 20.3% |
| Immigrants | North America | 89.5 /100 | #141 | Excellent 20.3% |
| Immigrants | Uganda | 89.1 /100 | #142 | Excellent 20.3% |
| Australians | 88.4 /100 | #143 | Excellent 20.3% |
| Immigrants | Uzbekistan | 88.3 /100 | #144 | Excellent 20.3% |
| Austrians | 85.8 /100 | #145 | Excellent 20.4% |
| Venezuelans | 85.5 /100 | #146 | Excellent 20.4% |
| South Africans | 85.3 /100 | #147 | Excellent 20.4% |
| Luxembourgers | 84.9 /100 | #148 | Excellent 20.4% |
| Portuguese | 81.5 /100 | #149 | Excellent 20.5% |
| Immigrants | Denmark | 80.5 /100 | #150 | Excellent 20.5% |
| Puget Sound Salish | 79.6 /100 | #151 | Good 20.6% |
| Immigrants | Uruguay | 77.7 /100 | #152 | Good 20.6% |
| Swedes | 77.1 /100 | #153 | Good 20.6% |