Syrian vs Immigrants from Eritrea Receiving Food Stamps
COMPARE
Syrian
Immigrants from Eritrea
Receiving Food Stamps
Receiving Food Stamps Comparison
Syrians
Immigrants from Eritrea
11.0%
RECEIVING FOOD STAMPS
85.5/ 100
METRIC RATING
144th/ 347
METRIC RANK
11.7%
RECEIVING FOOD STAMPS
50.0/ 100
METRIC RATING
174th/ 347
METRIC RANK
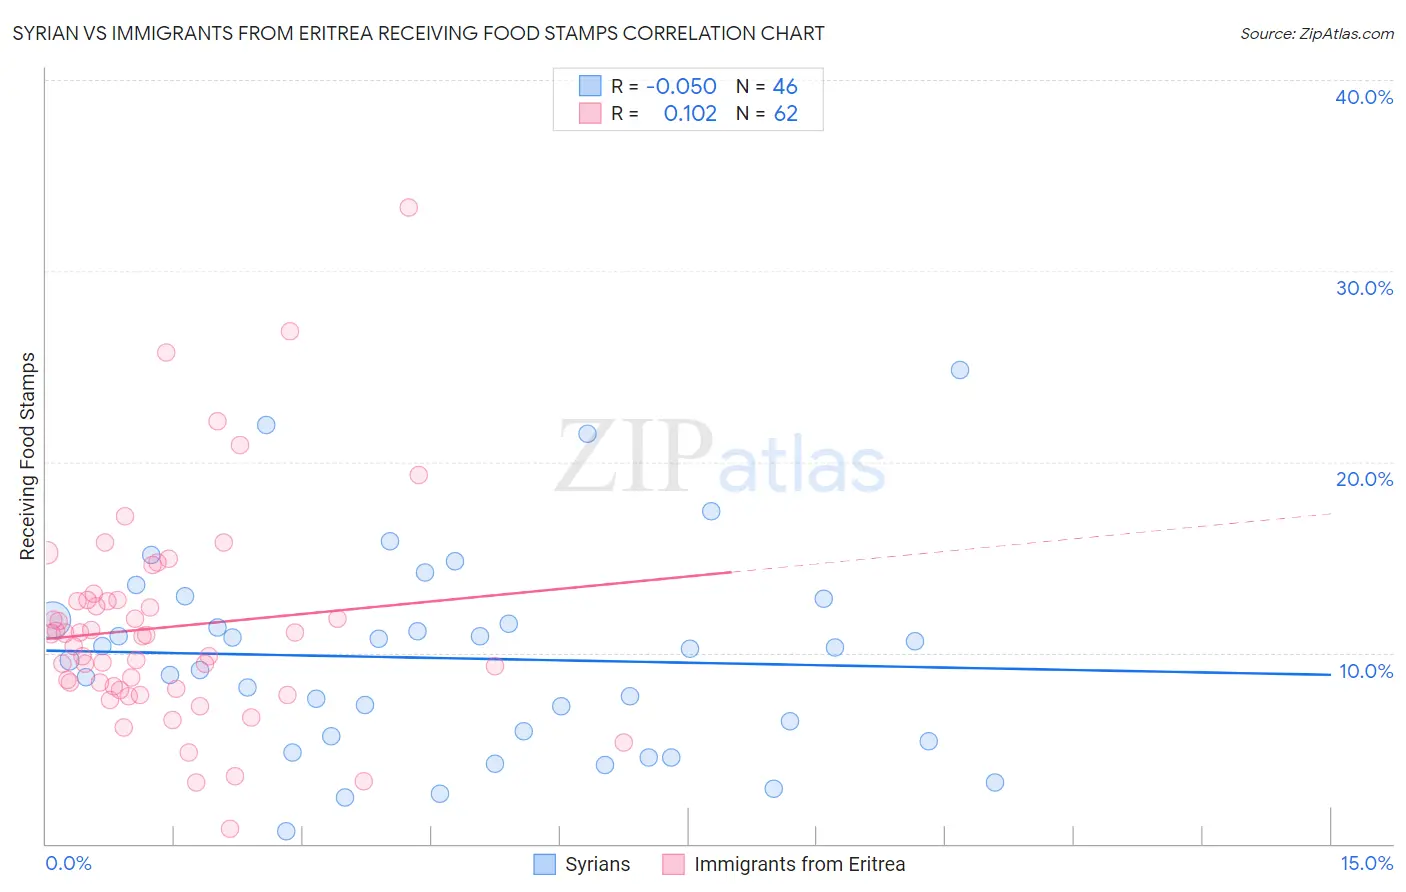
Syrian vs Immigrants from Eritrea Receiving Food Stamps Correlation Chart
The statistical analysis conducted on geographies consisting of 265,711,936 people shows a slight negative correlation between the proportion of Syrians and percentage of population receiving government assistance and/or food stamps in the United States with a correlation coefficient (R) of -0.050 and weighted average of 11.0%. Similarly, the statistical analysis conducted on geographies consisting of 104,840,679 people shows a poor positive correlation between the proportion of Immigrants from Eritrea and percentage of population receiving government assistance and/or food stamps in the United States with a correlation coefficient (R) of 0.102 and weighted average of 11.7%, a difference of 6.6%.
Receiving Food Stamps Correlation Summary
| Measurement | Syrian | Immigrants from Eritrea |
| Minimum | 0.68% | 0.80% |
| Maximum | 24.8% | 33.3% |
| Range | 24.1% | 32.5% |
| Mean | 9.7% | 11.4% |
| Median | 9.9% | 10.9% |
| Interquartile 25% (IQ1) | 5.6% | 8.1% |
| Interquartile 75% (IQ3) | 11.7% | 12.8% |
| Interquartile Range (IQR) | 6.1% | 4.7% |
| Standard Deviation (Sample) | 5.3% | 5.7% |
| Standard Deviation (Population) | 5.2% | 5.6% |
Similar Demographics by Receiving Food Stamps
Demographics Similar to Syrians by Receiving Food Stamps
In terms of receiving food stamps, the demographic groups most similar to Syrians are Hungarian (11.0%, a difference of 0.12%), Immigrants from Northern Africa (11.0%, a difference of 0.15%), Chilean (11.0%, a difference of 0.23%), Taiwanese (11.0%, a difference of 0.36%), and Immigrants from Vietnam (11.0%, a difference of 0.40%).
| Demographics | Rating | Rank | Receiving Food Stamps |
| Immigrants | Eastern Europe | 89.8 /100 | #137 | Excellent 10.8% |
| Immigrants | Moldova | 88.5 /100 | #138 | Excellent 10.9% |
| Hmong | 88.4 /100 | #139 | Excellent 10.9% |
| Celtics | 87.8 /100 | #140 | Excellent 10.9% |
| Immigrants | Vietnam | 86.7 /100 | #141 | Excellent 11.0% |
| Chileans | 86.2 /100 | #142 | Excellent 11.0% |
| Immigrants | Northern Africa | 86.0 /100 | #143 | Excellent 11.0% |
| Syrians | 85.5 /100 | #144 | Excellent 11.0% |
| Hungarians | 85.1 /100 | #145 | Excellent 11.0% |
| Taiwanese | 84.2 /100 | #146 | Excellent 11.0% |
| Whites/Caucasians | 83.9 /100 | #147 | Excellent 11.1% |
| Immigrants | South Eastern Asia | 83.3 /100 | #148 | Excellent 11.1% |
| Brazilians | 83.2 /100 | #149 | Excellent 11.1% |
| Soviet Union | 83.1 /100 | #150 | Excellent 11.1% |
| Immigrants | Spain | 81.7 /100 | #151 | Excellent 11.1% |
Demographics Similar to Immigrants from Eritrea by Receiving Food Stamps
In terms of receiving food stamps, the demographic groups most similar to Immigrants from Eritrea are Osage (11.7%, a difference of 0.020%), Peruvian (11.7%, a difference of 0.10%), Immigrants from Ukraine (11.8%, a difference of 0.23%), German Russian (11.8%, a difference of 0.26%), and Immigrants from Syria (11.7%, a difference of 0.48%).
| Demographics | Rating | Rank | Receiving Food Stamps |
| Kenyans | 60.2 /100 | #167 | Good 11.6% |
| Tlingit-Haida | 59.1 /100 | #168 | Average 11.6% |
| Immigrants | Eastern Africa | 58.3 /100 | #169 | Average 11.6% |
| Costa Ricans | 57.9 /100 | #170 | Average 11.6% |
| Immigrants | Western Asia | 56.4 /100 | #171 | Average 11.6% |
| Guamanians/Chamorros | 54.2 /100 | #172 | Average 11.7% |
| Immigrants | Syria | 53.4 /100 | #173 | Average 11.7% |
| Immigrants | Eritrea | 50.0 /100 | #174 | Average 11.7% |
| Osage | 49.8 /100 | #175 | Average 11.7% |
| Peruvians | 49.3 /100 | #176 | Average 11.7% |
| Immigrants | Ukraine | 48.4 /100 | #177 | Average 11.8% |
| German Russians | 48.1 /100 | #178 | Average 11.8% |
| Immigrants | Kenya | 46.4 /100 | #179 | Average 11.8% |
| Uruguayans | 44.8 /100 | #180 | Average 11.8% |
| South American Indians | 41.7 /100 | #181 | Average 11.9% |