Syrian vs Paraguayan Receiving Food Stamps
COMPARE
Syrian
Paraguayan
Receiving Food Stamps
Receiving Food Stamps Comparison
Syrians
Paraguayans
11.0%
RECEIVING FOOD STAMPS
85.5/ 100
METRIC RATING
144th/ 347
METRIC RANK
10.7%
RECEIVING FOOD STAMPS
93.0/ 100
METRIC RATING
124th/ 347
METRIC RANK
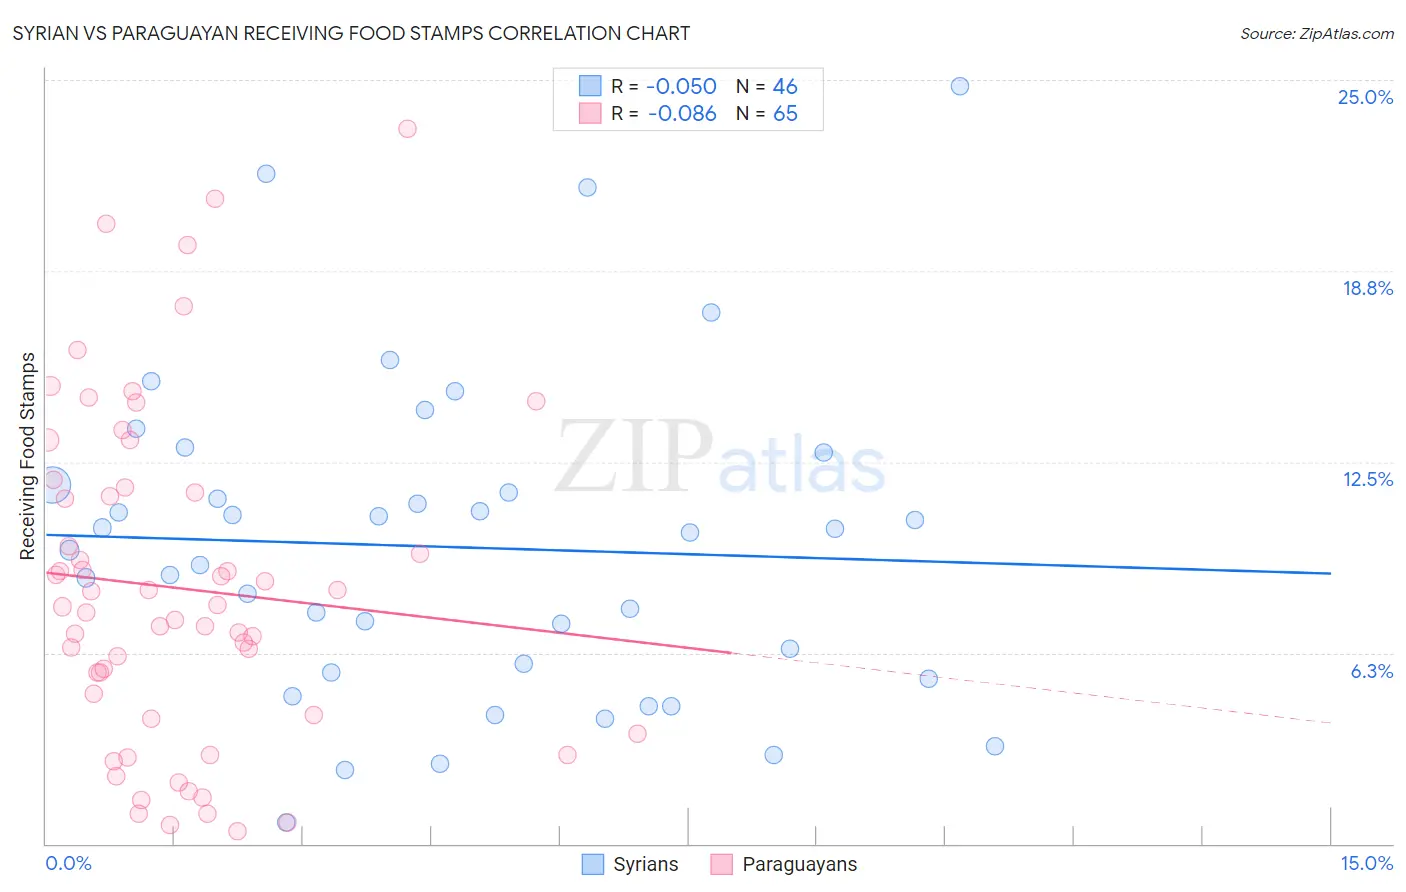
Syrian vs Paraguayan Receiving Food Stamps Correlation Chart
The statistical analysis conducted on geographies consisting of 265,711,936 people shows a slight negative correlation between the proportion of Syrians and percentage of population receiving government assistance and/or food stamps in the United States with a correlation coefficient (R) of -0.050 and weighted average of 11.0%. Similarly, the statistical analysis conducted on geographies consisting of 95,051,783 people shows a slight negative correlation between the proportion of Paraguayans and percentage of population receiving government assistance and/or food stamps in the United States with a correlation coefficient (R) of -0.086 and weighted average of 10.7%, a difference of 3.1%.
Receiving Food Stamps Correlation Summary
| Measurement | Syrian | Paraguayan |
| Minimum | 0.68% | 0.40% |
| Maximum | 24.8% | 23.4% |
| Range | 24.1% | 23.0% |
| Mean | 9.7% | 8.4% |
| Median | 9.9% | 7.8% |
| Interquartile 25% (IQ1) | 5.6% | 4.2% |
| Interquartile 75% (IQ3) | 11.7% | 11.6% |
| Interquartile Range (IQR) | 6.1% | 7.4% |
| Standard Deviation (Sample) | 5.3% | 5.4% |
| Standard Deviation (Population) | 5.2% | 5.4% |
Demographics Similar to Syrians and Paraguayans by Receiving Food Stamps
In terms of receiving food stamps, the demographic groups most similar to Syrians are Immigrants from Northern Africa (11.0%, a difference of 0.15%), Chilean (11.0%, a difference of 0.23%), Immigrants from Vietnam (11.0%, a difference of 0.40%), Celtic (10.9%, a difference of 0.76%), and Hmong (10.9%, a difference of 0.96%). Similarly, the demographic groups most similar to Paraguayans are Ukrainian (10.7%, a difference of 0.080%), Afghan (10.7%, a difference of 0.22%), Immigrants from Ethiopia (10.7%, a difference of 0.25%), Immigrants from Jordan (10.7%, a difference of 0.26%), and Yugoslavian (10.7%, a difference of 0.26%).
| Demographics | Rating | Rank | Receiving Food Stamps |
| Paraguayans | 93.0 /100 | #124 | Exceptional 10.7% |
| Ukrainians | 92.8 /100 | #125 | Exceptional 10.7% |
| Afghans | 92.6 /100 | #126 | Exceptional 10.7% |
| Immigrants | Ethiopia | 92.6 /100 | #127 | Exceptional 10.7% |
| Immigrants | Jordan | 92.5 /100 | #128 | Exceptional 10.7% |
| Yugoslavians | 92.5 /100 | #129 | Exceptional 10.7% |
| Israelis | 92.4 /100 | #130 | Exceptional 10.7% |
| French | 92.3 /100 | #131 | Exceptional 10.7% |
| Immigrants | Germany | 92.0 /100 | #132 | Exceptional 10.7% |
| Immigrants | Russia | 90.9 /100 | #133 | Exceptional 10.8% |
| Immigrants | Brazil | 90.3 /100 | #134 | Exceptional 10.8% |
| Argentineans | 90.2 /100 | #135 | Exceptional 10.8% |
| Slovaks | 89.8 /100 | #136 | Excellent 10.8% |
| Immigrants | Eastern Europe | 89.8 /100 | #137 | Excellent 10.8% |
| Immigrants | Moldova | 88.5 /100 | #138 | Excellent 10.9% |
| Hmong | 88.4 /100 | #139 | Excellent 10.9% |
| Celtics | 87.8 /100 | #140 | Excellent 10.9% |
| Immigrants | Vietnam | 86.7 /100 | #141 | Excellent 11.0% |
| Chileans | 86.2 /100 | #142 | Excellent 11.0% |
| Immigrants | Northern Africa | 86.0 /100 | #143 | Excellent 11.0% |
| Syrians | 85.5 /100 | #144 | Excellent 11.0% |