Syrian vs Potawatomi Receiving Food Stamps
COMPARE
Syrian
Potawatomi
Receiving Food Stamps
Receiving Food Stamps Comparison
Syrians
Potawatomi
11.0%
RECEIVING FOOD STAMPS
85.5/ 100
METRIC RATING
144th/ 347
METRIC RANK
12.5%
RECEIVING FOOD STAMPS
14.6/ 100
METRIC RATING
208th/ 347
METRIC RANK
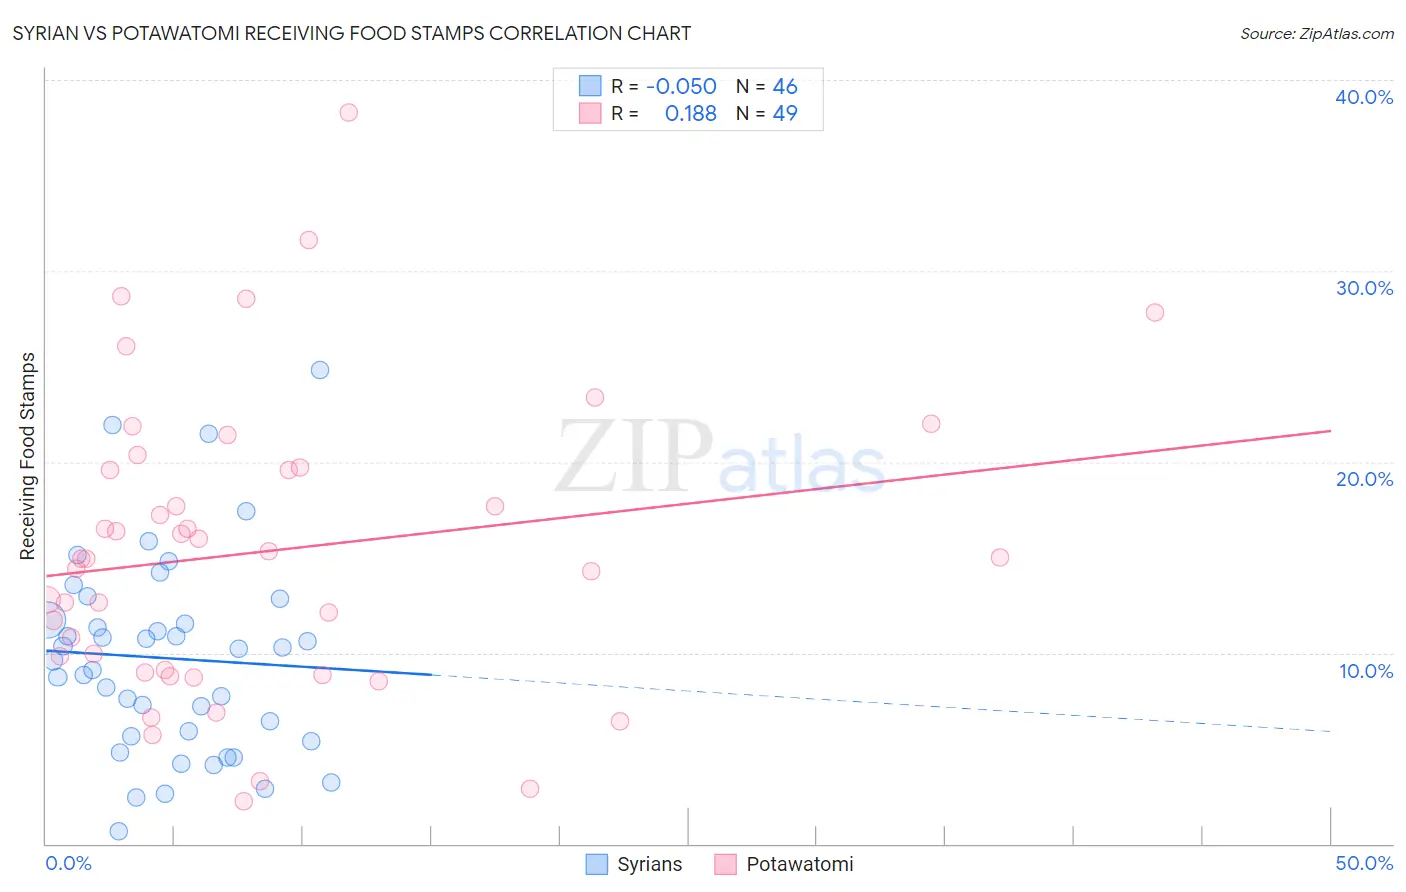
Syrian vs Potawatomi Receiving Food Stamps Correlation Chart
The statistical analysis conducted on geographies consisting of 265,711,936 people shows a slight negative correlation between the proportion of Syrians and percentage of population receiving government assistance and/or food stamps in the United States with a correlation coefficient (R) of -0.050 and weighted average of 11.0%. Similarly, the statistical analysis conducted on geographies consisting of 117,725,542 people shows a poor positive correlation between the proportion of Potawatomi and percentage of population receiving government assistance and/or food stamps in the United States with a correlation coefficient (R) of 0.188 and weighted average of 12.5%, a difference of 13.2%.
Receiving Food Stamps Correlation Summary
| Measurement | Syrian | Potawatomi |
| Minimum | 0.68% | 2.2% |
| Maximum | 24.8% | 38.3% |
| Range | 24.1% | 36.1% |
| Mean | 9.7% | 15.3% |
| Median | 9.9% | 15.0% |
| Interquartile 25% (IQ1) | 5.6% | 9.1% |
| Interquartile 75% (IQ3) | 11.7% | 19.6% |
| Interquartile Range (IQR) | 6.1% | 10.6% |
| Standard Deviation (Sample) | 5.3% | 7.7% |
| Standard Deviation (Population) | 5.2% | 7.7% |
Similar Demographics by Receiving Food Stamps
Demographics Similar to Syrians by Receiving Food Stamps
In terms of receiving food stamps, the demographic groups most similar to Syrians are Hungarian (11.0%, a difference of 0.12%), Immigrants from Northern Africa (11.0%, a difference of 0.15%), Chilean (11.0%, a difference of 0.23%), Taiwanese (11.0%, a difference of 0.36%), and Immigrants from Vietnam (11.0%, a difference of 0.40%).
| Demographics | Rating | Rank | Receiving Food Stamps |
| Immigrants | Eastern Europe | 89.8 /100 | #137 | Excellent 10.8% |
| Immigrants | Moldova | 88.5 /100 | #138 | Excellent 10.9% |
| Hmong | 88.4 /100 | #139 | Excellent 10.9% |
| Celtics | 87.8 /100 | #140 | Excellent 10.9% |
| Immigrants | Vietnam | 86.7 /100 | #141 | Excellent 11.0% |
| Chileans | 86.2 /100 | #142 | Excellent 11.0% |
| Immigrants | Northern Africa | 86.0 /100 | #143 | Excellent 11.0% |
| Syrians | 85.5 /100 | #144 | Excellent 11.0% |
| Hungarians | 85.1 /100 | #145 | Excellent 11.0% |
| Taiwanese | 84.2 /100 | #146 | Excellent 11.0% |
| Whites/Caucasians | 83.9 /100 | #147 | Excellent 11.1% |
| Immigrants | South Eastern Asia | 83.3 /100 | #148 | Excellent 11.1% |
| Brazilians | 83.2 /100 | #149 | Excellent 11.1% |
| Soviet Union | 83.1 /100 | #150 | Excellent 11.1% |
| Immigrants | Spain | 81.7 /100 | #151 | Excellent 11.1% |
Demographics Similar to Potawatomi by Receiving Food Stamps
In terms of receiving food stamps, the demographic groups most similar to Potawatomi are South American (12.4%, a difference of 0.36%), Immigrants from Sierra Leone (12.5%, a difference of 0.47%), Immigrants from Uruguay (12.5%, a difference of 0.50%), Immigrants from Thailand (12.4%, a difference of 0.62%), and Aleut (12.4%, a difference of 0.68%).
| Demographics | Rating | Rank | Receiving Food Stamps |
| Ugandans | 22.5 /100 | #201 | Fair 12.2% |
| Immigrants | Venezuela | 20.1 /100 | #202 | Fair 12.3% |
| Shoshone | 17.7 /100 | #203 | Poor 12.4% |
| Immigrants | Nonimmigrants | 17.6 /100 | #204 | Poor 12.4% |
| Aleuts | 17.3 /100 | #205 | Poor 12.4% |
| Immigrants | Thailand | 17.0 /100 | #206 | Poor 12.4% |
| South Americans | 16.0 /100 | #207 | Poor 12.4% |
| Potawatomi | 14.6 /100 | #208 | Poor 12.5% |
| Immigrants | Sierra Leone | 12.9 /100 | #209 | Poor 12.5% |
| Immigrants | Uruguay | 12.8 /100 | #210 | Poor 12.5% |
| Colombians | 10.2 /100 | #211 | Poor 12.6% |
| Malaysians | 8.5 /100 | #212 | Tragic 12.7% |
| Moroccans | 7.6 /100 | #213 | Tragic 12.8% |
| Immigrants | Africa | 7.6 /100 | #214 | Tragic 12.8% |
| Native Hawaiians | 6.7 /100 | #215 | Tragic 12.8% |