Syrian vs Immigrants from Eritrea No Schooling Completed
COMPARE
Syrian
Immigrants from Eritrea
No Schooling Completed
No Schooling Completed Comparison
Syrians
Immigrants from Eritrea
1.9%
NO SCHOOLING COMPLETED
96.0/ 100
METRIC RATING
115th/ 347
METRIC RANK
2.8%
NO SCHOOLING COMPLETED
0.0/ 100
METRIC RATING
294th/ 347
METRIC RANK
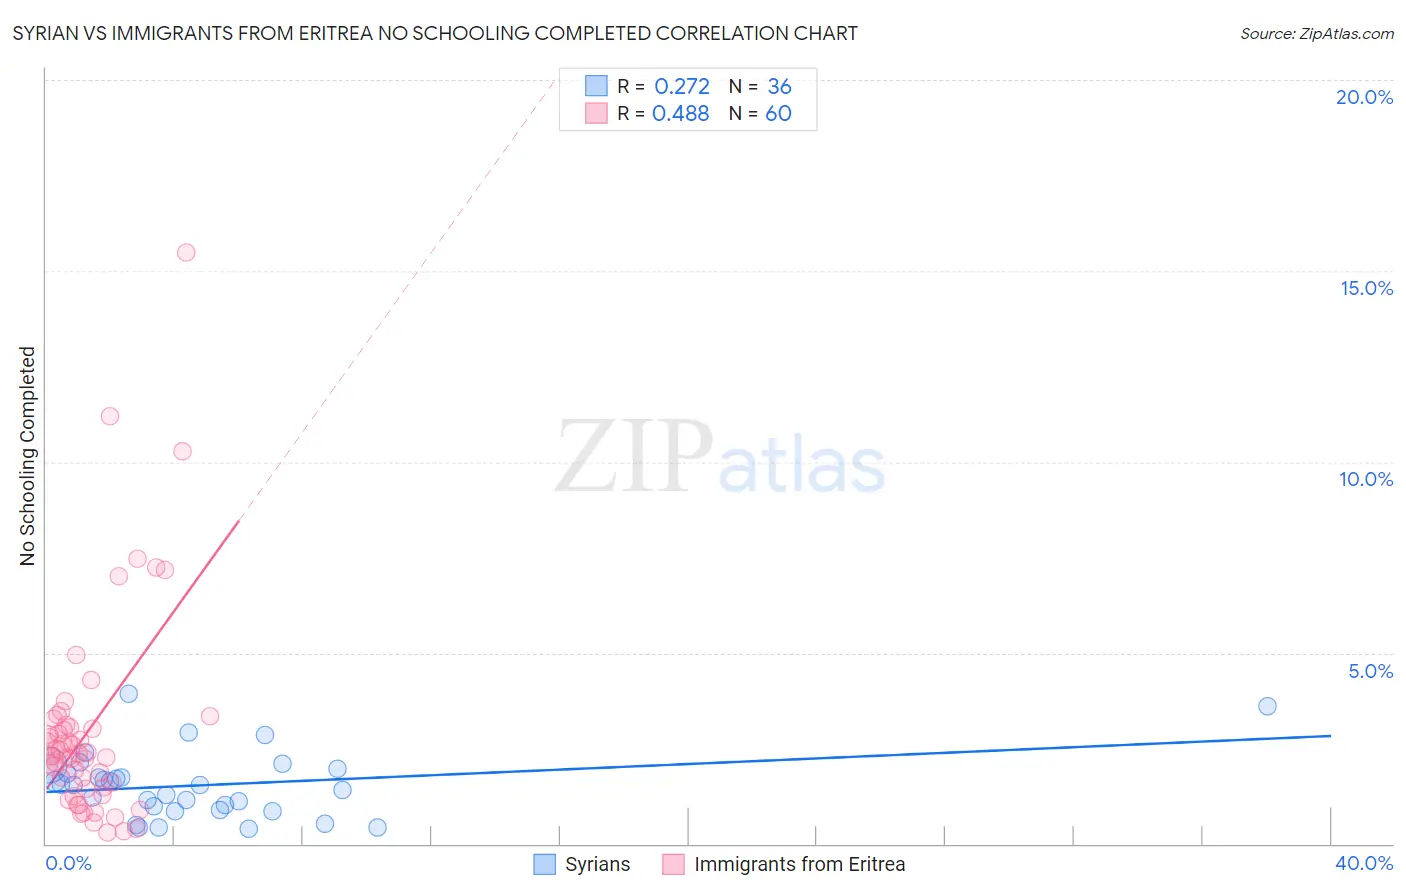
Syrian vs Immigrants from Eritrea No Schooling Completed Correlation Chart
The statistical analysis conducted on geographies consisting of 264,321,115 people shows a weak positive correlation between the proportion of Syrians and percentage of population with no schooling in the United States with a correlation coefficient (R) of 0.272 and weighted average of 1.9%. Similarly, the statistical analysis conducted on geographies consisting of 104,735,376 people shows a moderate positive correlation between the proportion of Immigrants from Eritrea and percentage of population with no schooling in the United States with a correlation coefficient (R) of 0.488 and weighted average of 2.8%, a difference of 48.4%.
No Schooling Completed Correlation Summary
| Measurement | Syrian | Immigrants from Eritrea |
| Minimum | 0.39% | 0.30% |
| Maximum | 3.9% | 15.5% |
| Range | 3.5% | 15.2% |
| Mean | 1.5% | 3.0% |
| Median | 1.5% | 2.3% |
| Interquartile 25% (IQ1) | 0.93% | 1.4% |
| Interquartile 75% (IQ3) | 1.9% | 3.1% |
| Interquartile Range (IQR) | 0.97% | 1.6% |
| Standard Deviation (Sample) | 0.85% | 2.7% |
| Standard Deviation (Population) | 0.84% | 2.7% |
Similar Demographics by No Schooling Completed
Demographics Similar to Syrians by No Schooling Completed
In terms of no schooling completed, the demographic groups most similar to Syrians are Lebanese (1.9%, a difference of 0.020%), Immigrants from Norway (1.9%, a difference of 0.13%), Immigrants from Zimbabwe (1.9%, a difference of 0.14%), Immigrants from Serbia (1.9%, a difference of 0.22%), and Pueblo (1.9%, a difference of 0.38%).
| Demographics | Rating | Rank | No Schooling Completed |
| Okinawans | 97.1 /100 | #108 | Exceptional 1.8% |
| Immigrants | Saudi Arabia | 96.8 /100 | #109 | Exceptional 1.9% |
| Immigrants | Latvia | 96.7 /100 | #110 | Exceptional 1.9% |
| Immigrants | Japan | 96.6 /100 | #111 | Exceptional 1.9% |
| Pueblo | 96.4 /100 | #112 | Exceptional 1.9% |
| Immigrants | Zimbabwe | 96.2 /100 | #113 | Exceptional 1.9% |
| Immigrants | Norway | 96.1 /100 | #114 | Exceptional 1.9% |
| Syrians | 96.0 /100 | #115 | Exceptional 1.9% |
| Lebanese | 96.0 /100 | #116 | Exceptional 1.9% |
| Immigrants | Serbia | 95.8 /100 | #117 | Exceptional 1.9% |
| Spanish | 95.5 /100 | #118 | Exceptional 1.9% |
| Iroquois | 95.1 /100 | #119 | Exceptional 1.9% |
| Immigrants | Bulgaria | 94.6 /100 | #120 | Exceptional 1.9% |
| Immigrants | Croatia | 94.5 /100 | #121 | Exceptional 1.9% |
| Cree | 94.5 /100 | #122 | Exceptional 1.9% |
Demographics Similar to Immigrants from Eritrea by No Schooling Completed
In terms of no schooling completed, the demographic groups most similar to Immigrants from Eritrea are Malaysian (2.8%, a difference of 0.17%), Houma (2.8%, a difference of 0.52%), Immigrants from Grenada (2.8%, a difference of 0.58%), Immigrants (2.8%, a difference of 0.62%), and British West Indian (2.7%, a difference of 1.6%).
| Demographics | Rating | Rank | No Schooling Completed |
| Immigrants | Afghanistan | 0.0 /100 | #287 | Tragic 2.7% |
| Immigrants | St. Vincent and the Grenadines | 0.0 /100 | #288 | Tragic 2.7% |
| Immigrants | Thailand | 0.0 /100 | #289 | Tragic 2.7% |
| Immigrants | Hong Kong | 0.0 /100 | #290 | Tragic 2.7% |
| British West Indians | 0.0 /100 | #291 | Tragic 2.7% |
| Immigrants | Grenada | 0.0 /100 | #292 | Tragic 2.8% |
| Malaysians | 0.0 /100 | #293 | Tragic 2.8% |
| Immigrants | Eritrea | 0.0 /100 | #294 | Tragic 2.8% |
| Houma | 0.0 /100 | #295 | Tragic 2.8% |
| Immigrants | Immigrants | 0.0 /100 | #296 | Tragic 2.8% |
| Immigrants | Cuba | 0.0 /100 | #297 | Tragic 2.8% |
| Immigrants | Dominica | 0.0 /100 | #298 | Tragic 2.8% |
| Central American Indians | 0.0 /100 | #299 | Tragic 2.8% |
| Haitians | 0.0 /100 | #300 | Tragic 2.9% |
| Immigrants | South Eastern Asia | 0.0 /100 | #301 | Tragic 2.9% |