Syrian vs Nicaraguan Receiving Food Stamps
COMPARE
Syrian
Nicaraguan
Receiving Food Stamps
Receiving Food Stamps Comparison
Syrians
Nicaraguans
11.0%
RECEIVING FOOD STAMPS
85.5/ 100
METRIC RATING
144th/ 347
METRIC RANK
16.1%
RECEIVING FOOD STAMPS
0.0/ 100
METRIC RATING
303rd/ 347
METRIC RANK
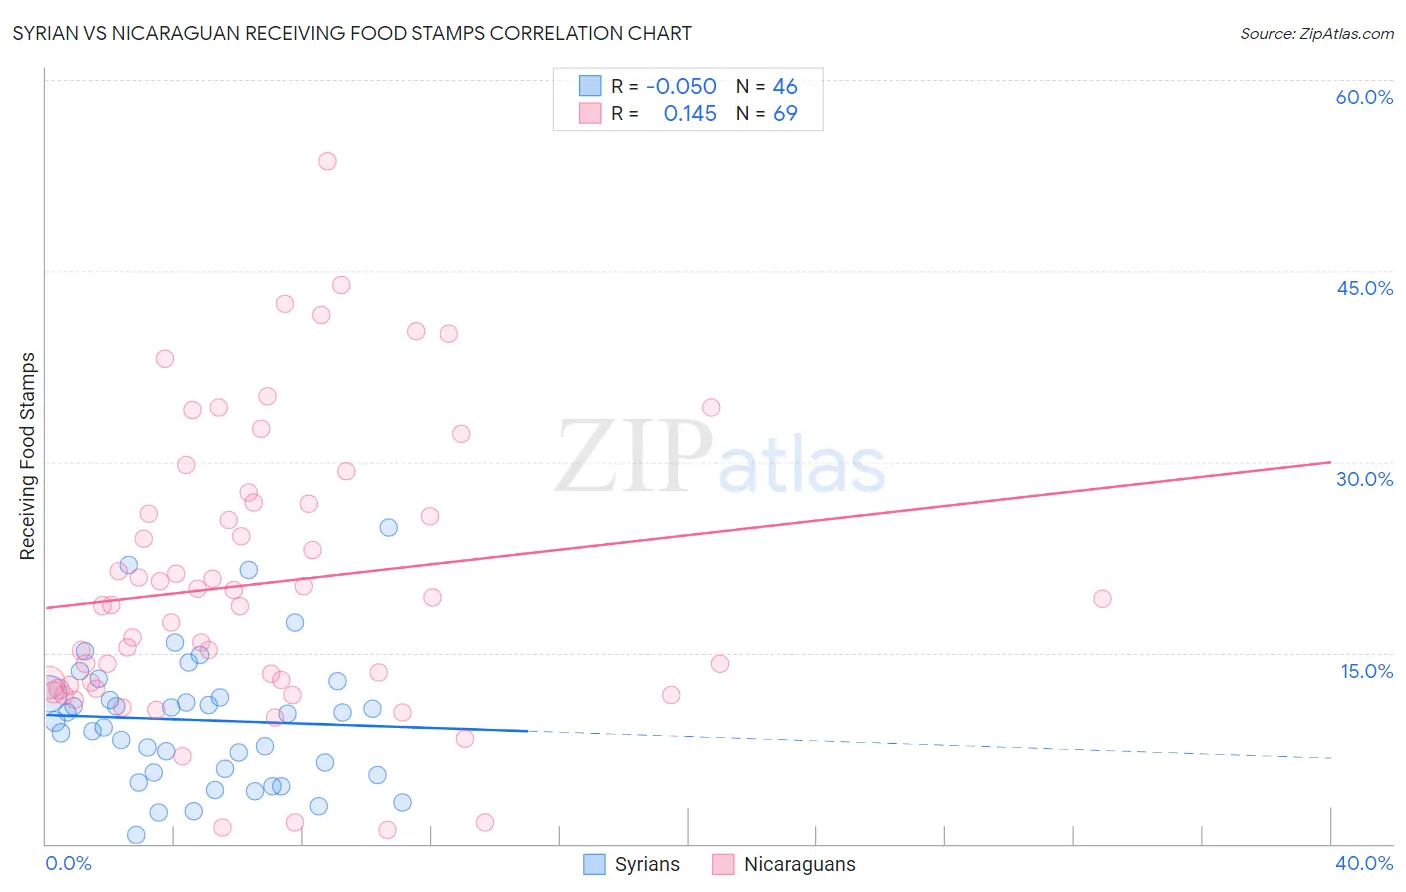
Syrian vs Nicaraguan Receiving Food Stamps Correlation Chart
The statistical analysis conducted on geographies consisting of 265,711,936 people shows a slight negative correlation between the proportion of Syrians and percentage of population receiving government assistance and/or food stamps in the United States with a correlation coefficient (R) of -0.050 and weighted average of 11.0%. Similarly, the statistical analysis conducted on geographies consisting of 285,345,977 people shows a poor positive correlation between the proportion of Nicaraguans and percentage of population receiving government assistance and/or food stamps in the United States with a correlation coefficient (R) of 0.145 and weighted average of 16.1%, a difference of 46.6%.
Receiving Food Stamps Correlation Summary
| Measurement | Syrian | Nicaraguan |
| Minimum | 0.68% | 1.1% |
| Maximum | 24.8% | 53.6% |
| Range | 24.1% | 52.5% |
| Mean | 9.7% | 20.4% |
| Median | 9.9% | 18.7% |
| Interquartile 25% (IQ1) | 5.6% | 12.3% |
| Interquartile 75% (IQ3) | 11.7% | 26.7% |
| Interquartile Range (IQR) | 6.1% | 14.4% |
| Standard Deviation (Sample) | 5.3% | 11.2% |
| Standard Deviation (Population) | 5.2% | 11.1% |
Similar Demographics by Receiving Food Stamps
Demographics Similar to Syrians by Receiving Food Stamps
In terms of receiving food stamps, the demographic groups most similar to Syrians are Hungarian (11.0%, a difference of 0.12%), Immigrants from Northern Africa (11.0%, a difference of 0.15%), Chilean (11.0%, a difference of 0.23%), Taiwanese (11.0%, a difference of 0.36%), and Immigrants from Vietnam (11.0%, a difference of 0.40%).
| Demographics | Rating | Rank | Receiving Food Stamps |
| Immigrants | Eastern Europe | 89.8 /100 | #137 | Excellent 10.8% |
| Immigrants | Moldova | 88.5 /100 | #138 | Excellent 10.9% |
| Hmong | 88.4 /100 | #139 | Excellent 10.9% |
| Celtics | 87.8 /100 | #140 | Excellent 10.9% |
| Immigrants | Vietnam | 86.7 /100 | #141 | Excellent 11.0% |
| Chileans | 86.2 /100 | #142 | Excellent 11.0% |
| Immigrants | Northern Africa | 86.0 /100 | #143 | Excellent 11.0% |
| Syrians | 85.5 /100 | #144 | Excellent 11.0% |
| Hungarians | 85.1 /100 | #145 | Excellent 11.0% |
| Taiwanese | 84.2 /100 | #146 | Excellent 11.0% |
| Whites/Caucasians | 83.9 /100 | #147 | Excellent 11.1% |
| Immigrants | South Eastern Asia | 83.3 /100 | #148 | Excellent 11.1% |
| Brazilians | 83.2 /100 | #149 | Excellent 11.1% |
| Soviet Union | 83.1 /100 | #150 | Excellent 11.1% |
| Immigrants | Spain | 81.7 /100 | #151 | Excellent 11.1% |
Demographics Similar to Nicaraguans by Receiving Food Stamps
In terms of receiving food stamps, the demographic groups most similar to Nicaraguans are Immigrants from West Indies (16.1%, a difference of 0.090%), West Indian (16.3%, a difference of 0.68%), Trinidadian and Tobagonian (16.0%, a difference of 1.0%), Immigrants from Bangladesh (15.9%, a difference of 1.5%), and Immigrants from the Azores (16.4%, a difference of 1.6%).
| Demographics | Rating | Rank | Receiving Food Stamps |
| Tsimshian | 0.0 /100 | #296 | Tragic 15.7% |
| Immigrants | Bahamas | 0.0 /100 | #297 | Tragic 15.8% |
| Immigrants | Trinidad and Tobago | 0.0 /100 | #298 | Tragic 15.8% |
| Hispanics or Latinos | 0.0 /100 | #299 | Tragic 15.8% |
| Immigrants | Bangladesh | 0.0 /100 | #300 | Tragic 15.9% |
| Trinidadians and Tobagonians | 0.0 /100 | #301 | Tragic 16.0% |
| Immigrants | West Indies | 0.0 /100 | #302 | Tragic 16.1% |
| Nicaraguans | 0.0 /100 | #303 | Tragic 16.1% |
| West Indians | 0.0 /100 | #304 | Tragic 16.3% |
| Immigrants | Azores | 0.0 /100 | #305 | Tragic 16.4% |
| Jamaicans | 0.0 /100 | #306 | Tragic 16.4% |
| Houma | 0.0 /100 | #307 | Tragic 16.5% |
| Barbadians | 0.0 /100 | #308 | Tragic 16.5% |
| U.S. Virgin Islanders | 0.0 /100 | #309 | Tragic 16.5% |
| Immigrants | Barbados | 0.0 /100 | #310 | Tragic 16.6% |