Hispanic or Latino vs Immigrants from Eritrea Receiving Food Stamps
COMPARE
Hispanic or Latino
Immigrants from Eritrea
Receiving Food Stamps
Receiving Food Stamps Comparison
Hispanics or Latinos
Immigrants from Eritrea
15.8%
RECEIVING FOOD STAMPS
0.0/ 100
METRIC RATING
299th/ 347
METRIC RANK
11.7%
RECEIVING FOOD STAMPS
50.0/ 100
METRIC RATING
174th/ 347
METRIC RANK
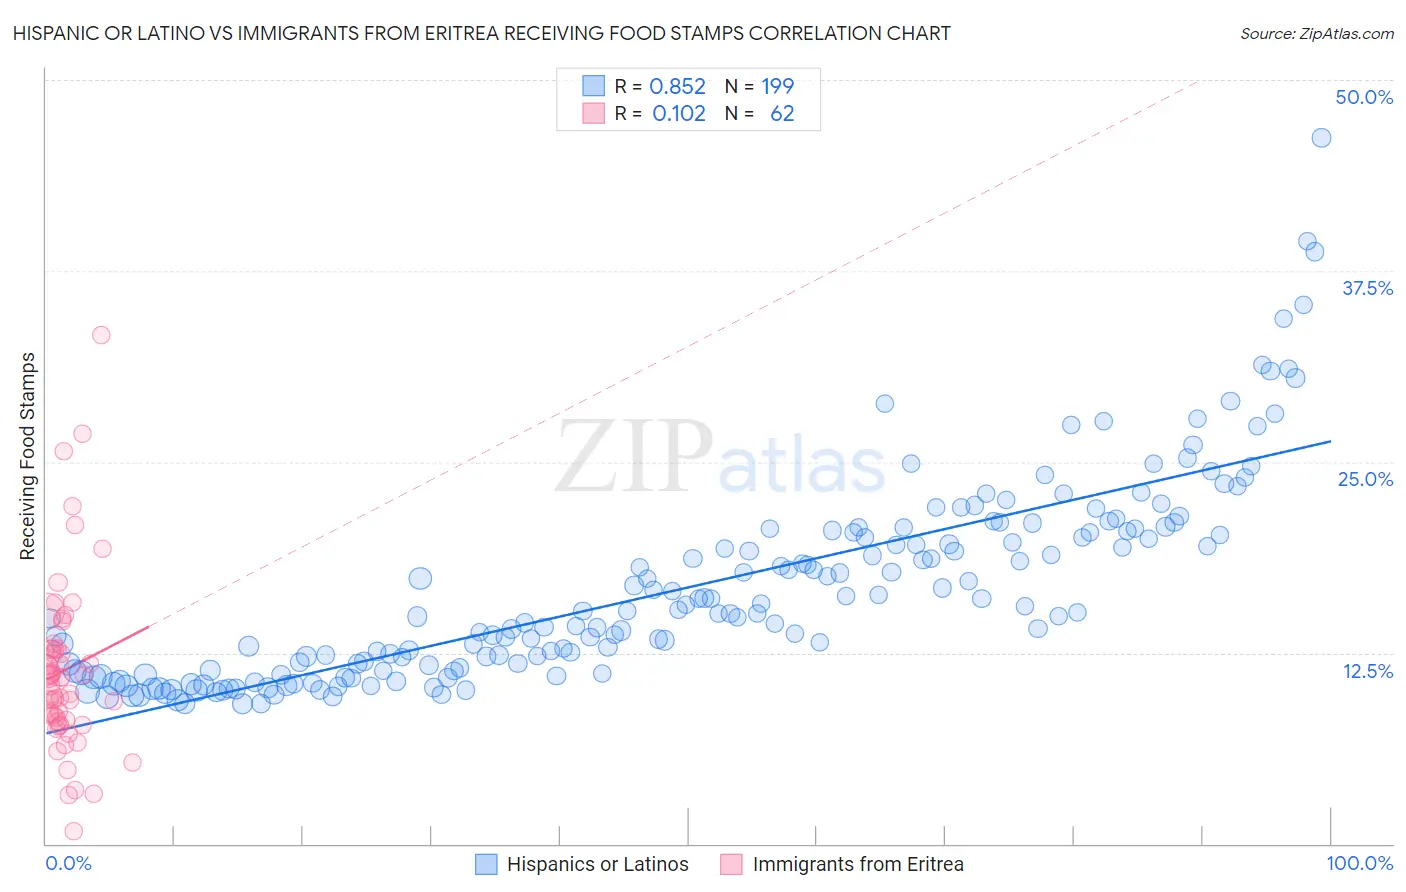
Hispanic or Latino vs Immigrants from Eritrea Receiving Food Stamps Correlation Chart
The statistical analysis conducted on geographies consisting of 573,421,418 people shows a very strong positive correlation between the proportion of Hispanics or Latinos and percentage of population receiving government assistance and/or food stamps in the United States with a correlation coefficient (R) of 0.852 and weighted average of 15.8%. Similarly, the statistical analysis conducted on geographies consisting of 104,840,679 people shows a poor positive correlation between the proportion of Immigrants from Eritrea and percentage of population receiving government assistance and/or food stamps in the United States with a correlation coefficient (R) of 0.102 and weighted average of 11.7%, a difference of 34.9%.
Receiving Food Stamps Correlation Summary
| Measurement | Hispanic or Latino | Immigrants from Eritrea |
| Minimum | 9.2% | 0.80% |
| Maximum | 46.2% | 33.3% |
| Range | 37.1% | 32.5% |
| Mean | 16.7% | 11.4% |
| Median | 15.2% | 10.9% |
| Interquartile 25% (IQ1) | 11.4% | 8.1% |
| Interquartile 75% (IQ3) | 20.4% | 12.8% |
| Interquartile Range (IQR) | 9.0% | 4.7% |
| Standard Deviation (Sample) | 6.5% | 5.7% |
| Standard Deviation (Population) | 6.4% | 5.6% |
Similar Demographics by Receiving Food Stamps
Demographics Similar to Hispanics or Latinos by Receiving Food Stamps
In terms of receiving food stamps, the demographic groups most similar to Hispanics or Latinos are Immigrants from Trinidad and Tobago (15.8%, a difference of 0.28%), Immigrants from Bangladesh (15.9%, a difference of 0.43%), Immigrants from Bahamas (15.8%, a difference of 0.53%), Tsimshian (15.7%, a difference of 0.69%), and Immigrants from Honduras (15.7%, a difference of 0.70%).
| Demographics | Rating | Rank | Receiving Food Stamps |
| Alaska Natives | 0.0 /100 | #292 | Tragic 15.6% |
| Vietnamese | 0.0 /100 | #293 | Tragic 15.7% |
| Immigrants | Latin America | 0.0 /100 | #294 | Tragic 15.7% |
| Immigrants | Honduras | 0.0 /100 | #295 | Tragic 15.7% |
| Tsimshian | 0.0 /100 | #296 | Tragic 15.7% |
| Immigrants | Bahamas | 0.0 /100 | #297 | Tragic 15.8% |
| Immigrants | Trinidad and Tobago | 0.0 /100 | #298 | Tragic 15.8% |
| Hispanics or Latinos | 0.0 /100 | #299 | Tragic 15.8% |
| Immigrants | Bangladesh | 0.0 /100 | #300 | Tragic 15.9% |
| Trinidadians and Tobagonians | 0.0 /100 | #301 | Tragic 16.0% |
| Immigrants | West Indies | 0.0 /100 | #302 | Tragic 16.1% |
| Nicaraguans | 0.0 /100 | #303 | Tragic 16.1% |
| West Indians | 0.0 /100 | #304 | Tragic 16.3% |
| Immigrants | Azores | 0.0 /100 | #305 | Tragic 16.4% |
| Jamaicans | 0.0 /100 | #306 | Tragic 16.4% |
Demographics Similar to Immigrants from Eritrea by Receiving Food Stamps
In terms of receiving food stamps, the demographic groups most similar to Immigrants from Eritrea are Osage (11.7%, a difference of 0.020%), Peruvian (11.7%, a difference of 0.10%), Immigrants from Ukraine (11.8%, a difference of 0.23%), German Russian (11.8%, a difference of 0.26%), and Immigrants from Syria (11.7%, a difference of 0.48%).
| Demographics | Rating | Rank | Receiving Food Stamps |
| Kenyans | 60.2 /100 | #167 | Good 11.6% |
| Tlingit-Haida | 59.1 /100 | #168 | Average 11.6% |
| Immigrants | Eastern Africa | 58.3 /100 | #169 | Average 11.6% |
| Costa Ricans | 57.9 /100 | #170 | Average 11.6% |
| Immigrants | Western Asia | 56.4 /100 | #171 | Average 11.6% |
| Guamanians/Chamorros | 54.2 /100 | #172 | Average 11.7% |
| Immigrants | Syria | 53.4 /100 | #173 | Average 11.7% |
| Immigrants | Eritrea | 50.0 /100 | #174 | Average 11.7% |
| Osage | 49.8 /100 | #175 | Average 11.7% |
| Peruvians | 49.3 /100 | #176 | Average 11.7% |
| Immigrants | Ukraine | 48.4 /100 | #177 | Average 11.8% |
| German Russians | 48.1 /100 | #178 | Average 11.8% |
| Immigrants | Kenya | 46.4 /100 | #179 | Average 11.8% |
| Uruguayans | 44.8 /100 | #180 | Average 11.8% |
| South American Indians | 41.7 /100 | #181 | Average 11.9% |