Syrian vs Arab Receiving Food Stamps
COMPARE
Syrian
Arab
Receiving Food Stamps
Receiving Food Stamps Comparison
Syrians
Arabs
11.0%
RECEIVING FOOD STAMPS
85.5/ 100
METRIC RATING
144th/ 347
METRIC RANK
11.5%
RECEIVING FOOD STAMPS
64.7/ 100
METRIC RATING
165th/ 347
METRIC RANK
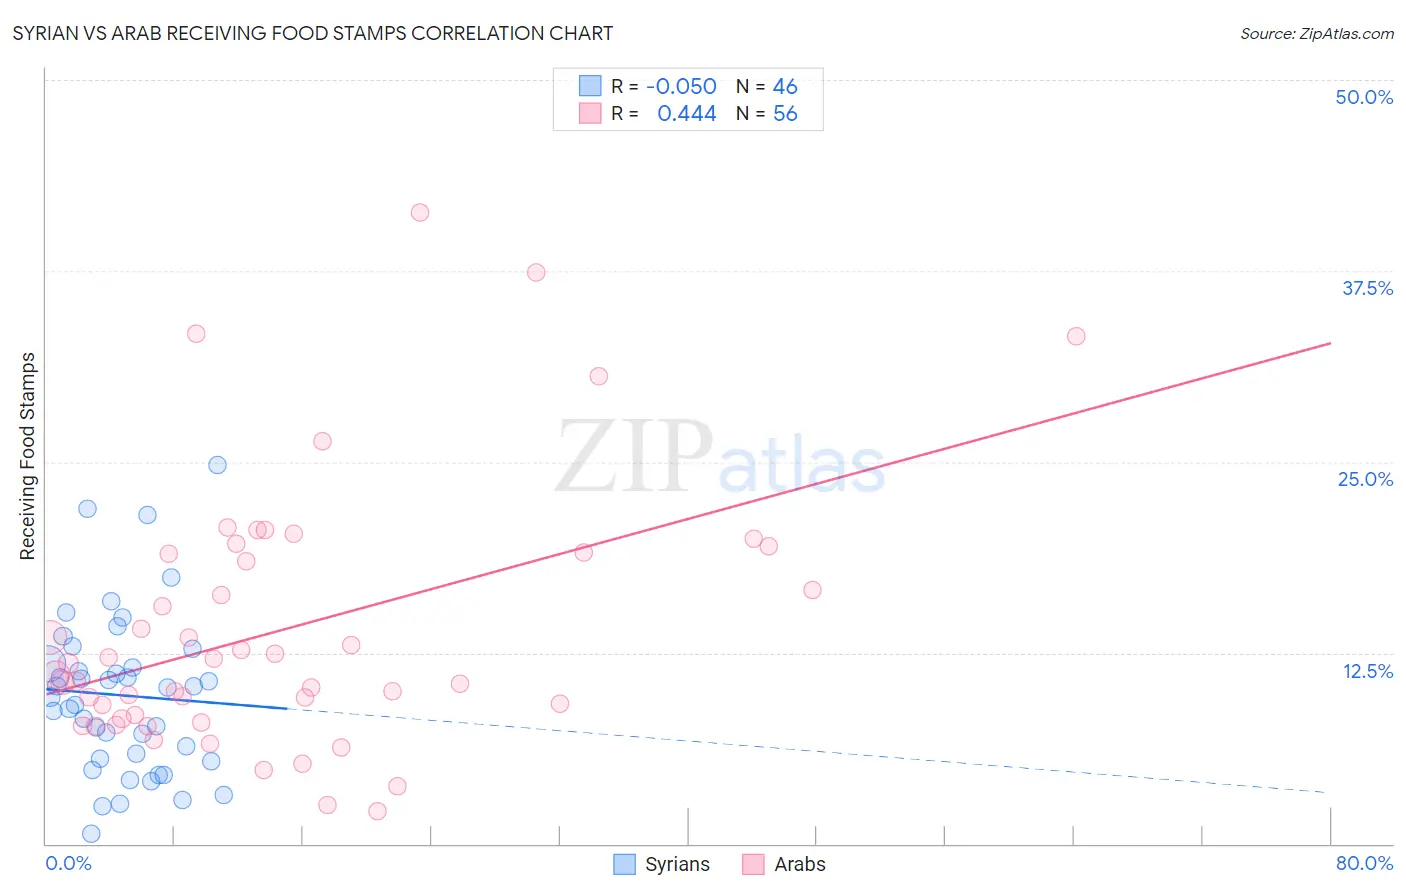
Syrian vs Arab Receiving Food Stamps Correlation Chart
The statistical analysis conducted on geographies consisting of 265,711,936 people shows a slight negative correlation between the proportion of Syrians and percentage of population receiving government assistance and/or food stamps in the United States with a correlation coefficient (R) of -0.050 and weighted average of 11.0%. Similarly, the statistical analysis conducted on geographies consisting of 484,746,764 people shows a moderate positive correlation between the proportion of Arabs and percentage of population receiving government assistance and/or food stamps in the United States with a correlation coefficient (R) of 0.444 and weighted average of 11.5%, a difference of 4.4%.
Receiving Food Stamps Correlation Summary
| Measurement | Syrian | Arab |
| Minimum | 0.68% | 2.1% |
| Maximum | 24.8% | 41.3% |
| Range | 24.1% | 39.2% |
| Mean | 9.7% | 14.1% |
| Median | 9.9% | 11.4% |
| Interquartile 25% (IQ1) | 5.6% | 8.3% |
| Interquartile 75% (IQ3) | 11.7% | 19.0% |
| Interquartile Range (IQR) | 6.1% | 10.7% |
| Standard Deviation (Sample) | 5.3% | 8.5% |
| Standard Deviation (Population) | 5.2% | 8.5% |
Similar Demographics by Receiving Food Stamps
Demographics Similar to Syrians by Receiving Food Stamps
In terms of receiving food stamps, the demographic groups most similar to Syrians are Hungarian (11.0%, a difference of 0.12%), Immigrants from Northern Africa (11.0%, a difference of 0.15%), Chilean (11.0%, a difference of 0.23%), Taiwanese (11.0%, a difference of 0.36%), and Immigrants from Vietnam (11.0%, a difference of 0.40%).
| Demographics | Rating | Rank | Receiving Food Stamps |
| Immigrants | Eastern Europe | 89.8 /100 | #137 | Excellent 10.8% |
| Immigrants | Moldova | 88.5 /100 | #138 | Excellent 10.9% |
| Hmong | 88.4 /100 | #139 | Excellent 10.9% |
| Celtics | 87.8 /100 | #140 | Excellent 10.9% |
| Immigrants | Vietnam | 86.7 /100 | #141 | Excellent 11.0% |
| Chileans | 86.2 /100 | #142 | Excellent 11.0% |
| Immigrants | Northern Africa | 86.0 /100 | #143 | Excellent 11.0% |
| Syrians | 85.5 /100 | #144 | Excellent 11.0% |
| Hungarians | 85.1 /100 | #145 | Excellent 11.0% |
| Taiwanese | 84.2 /100 | #146 | Excellent 11.0% |
| Whites/Caucasians | 83.9 /100 | #147 | Excellent 11.1% |
| Immigrants | South Eastern Asia | 83.3 /100 | #148 | Excellent 11.1% |
| Brazilians | 83.2 /100 | #149 | Excellent 11.1% |
| Soviet Union | 83.1 /100 | #150 | Excellent 11.1% |
| Immigrants | Spain | 81.7 /100 | #151 | Excellent 11.1% |
Demographics Similar to Arabs by Receiving Food Stamps
In terms of receiving food stamps, the demographic groups most similar to Arabs are Immigrants from Chile (11.5%, a difference of 0.050%), Immigrants from Southern Europe (11.5%, a difference of 0.17%), Immigrants from Belarus (11.5%, a difference of 0.30%), Alsatian (11.4%, a difference of 0.54%), and Pennsylvania German (11.4%, a difference of 0.60%).
| Demographics | Rating | Rank | Receiving Food Stamps |
| Immigrants | Bosnia and Herzegovina | 72.6 /100 | #158 | Good 11.3% |
| Immigrants | Oceania | 70.4 /100 | #159 | Good 11.4% |
| French Canadians | 69.5 /100 | #160 | Good 11.4% |
| Pennsylvania Germans | 68.4 /100 | #161 | Good 11.4% |
| Alsatians | 68.0 /100 | #162 | Good 11.4% |
| Immigrants | Southern Europe | 65.8 /100 | #163 | Good 11.5% |
| Immigrants | Chile | 65.0 /100 | #164 | Good 11.5% |
| Arabs | 64.7 /100 | #165 | Good 11.5% |
| Immigrants | Belarus | 62.8 /100 | #166 | Good 11.5% |
| Kenyans | 60.2 /100 | #167 | Good 11.6% |
| Tlingit-Haida | 59.1 /100 | #168 | Average 11.6% |
| Immigrants | Eastern Africa | 58.3 /100 | #169 | Average 11.6% |
| Costa Ricans | 57.9 /100 | #170 | Average 11.6% |
| Immigrants | Western Asia | 56.4 /100 | #171 | Average 11.6% |
| Guamanians/Chamorros | 54.2 /100 | #172 | Average 11.7% |