Paraguayan vs Immigrants from Eritrea Receiving Food Stamps
COMPARE
Paraguayan
Immigrants from Eritrea
Receiving Food Stamps
Receiving Food Stamps Comparison
Paraguayans
Immigrants from Eritrea
10.7%
RECEIVING FOOD STAMPS
93.0/ 100
METRIC RATING
124th/ 347
METRIC RANK
11.7%
RECEIVING FOOD STAMPS
50.0/ 100
METRIC RATING
174th/ 347
METRIC RANK
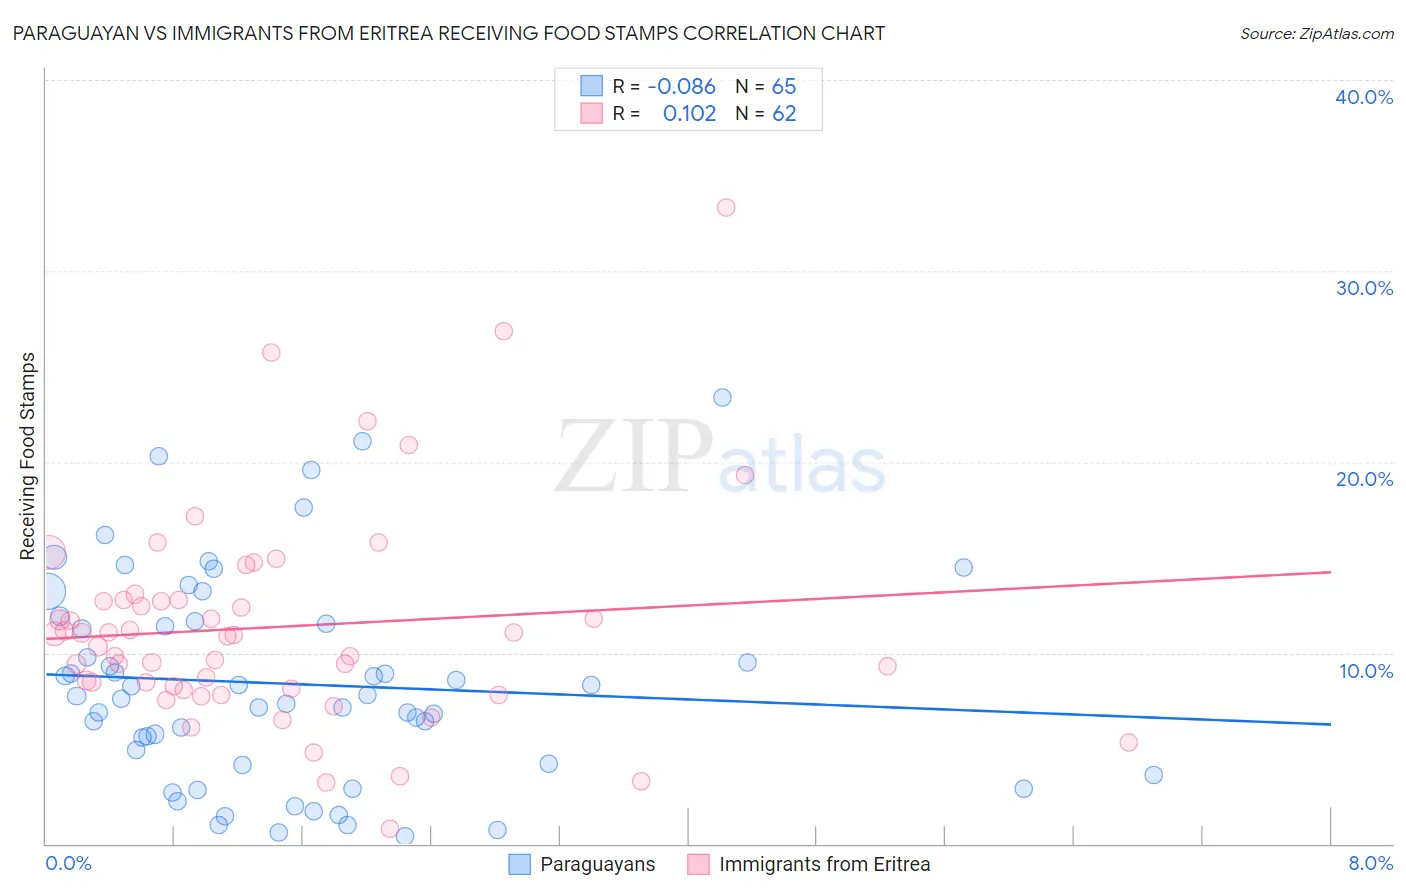
Paraguayan vs Immigrants from Eritrea Receiving Food Stamps Correlation Chart
The statistical analysis conducted on geographies consisting of 95,051,783 people shows a slight negative correlation between the proportion of Paraguayans and percentage of population receiving government assistance and/or food stamps in the United States with a correlation coefficient (R) of -0.086 and weighted average of 10.7%. Similarly, the statistical analysis conducted on geographies consisting of 104,840,679 people shows a poor positive correlation between the proportion of Immigrants from Eritrea and percentage of population receiving government assistance and/or food stamps in the United States with a correlation coefficient (R) of 0.102 and weighted average of 11.7%, a difference of 10.0%.
Receiving Food Stamps Correlation Summary
| Measurement | Paraguayan | Immigrants from Eritrea |
| Minimum | 0.40% | 0.80% |
| Maximum | 23.4% | 33.3% |
| Range | 23.0% | 32.5% |
| Mean | 8.4% | 11.4% |
| Median | 7.8% | 10.9% |
| Interquartile 25% (IQ1) | 4.2% | 8.1% |
| Interquartile 75% (IQ3) | 11.6% | 12.8% |
| Interquartile Range (IQR) | 7.4% | 4.7% |
| Standard Deviation (Sample) | 5.4% | 5.7% |
| Standard Deviation (Population) | 5.4% | 5.6% |
Similar Demographics by Receiving Food Stamps
Demographics Similar to Paraguayans by Receiving Food Stamps
In terms of receiving food stamps, the demographic groups most similar to Paraguayans are Ukrainian (10.7%, a difference of 0.080%), Immigrants from Philippines (10.7%, a difference of 0.21%), Afghan (10.7%, a difference of 0.22%), Immigrants from Ethiopia (10.7%, a difference of 0.25%), and Immigrants from Jordan (10.7%, a difference of 0.26%).
| Demographics | Rating | Rank | Receiving Food Stamps |
| Immigrants | Nepal | 94.6 /100 | #117 | Exceptional 10.6% |
| Assyrians/Chaldeans/Syriacs | 94.1 /100 | #118 | Exceptional 10.6% |
| Immigrants | Poland | 93.9 /100 | #119 | Exceptional 10.6% |
| Ethiopians | 93.9 /100 | #120 | Exceptional 10.6% |
| Slavs | 93.8 /100 | #121 | Exceptional 10.6% |
| Sri Lankans | 93.7 /100 | #122 | Exceptional 10.6% |
| Immigrants | Philippines | 93.3 /100 | #123 | Exceptional 10.7% |
| Paraguayans | 93.0 /100 | #124 | Exceptional 10.7% |
| Ukrainians | 92.8 /100 | #125 | Exceptional 10.7% |
| Afghans | 92.6 /100 | #126 | Exceptional 10.7% |
| Immigrants | Ethiopia | 92.6 /100 | #127 | Exceptional 10.7% |
| Immigrants | Jordan | 92.5 /100 | #128 | Exceptional 10.7% |
| Yugoslavians | 92.5 /100 | #129 | Exceptional 10.7% |
| Israelis | 92.4 /100 | #130 | Exceptional 10.7% |
| French | 92.3 /100 | #131 | Exceptional 10.7% |
Demographics Similar to Immigrants from Eritrea by Receiving Food Stamps
In terms of receiving food stamps, the demographic groups most similar to Immigrants from Eritrea are Osage (11.7%, a difference of 0.020%), Peruvian (11.7%, a difference of 0.10%), Immigrants from Ukraine (11.8%, a difference of 0.23%), German Russian (11.8%, a difference of 0.26%), and Immigrants from Syria (11.7%, a difference of 0.48%).
| Demographics | Rating | Rank | Receiving Food Stamps |
| Kenyans | 60.2 /100 | #167 | Good 11.6% |
| Tlingit-Haida | 59.1 /100 | #168 | Average 11.6% |
| Immigrants | Eastern Africa | 58.3 /100 | #169 | Average 11.6% |
| Costa Ricans | 57.9 /100 | #170 | Average 11.6% |
| Immigrants | Western Asia | 56.4 /100 | #171 | Average 11.6% |
| Guamanians/Chamorros | 54.2 /100 | #172 | Average 11.7% |
| Immigrants | Syria | 53.4 /100 | #173 | Average 11.7% |
| Immigrants | Eritrea | 50.0 /100 | #174 | Average 11.7% |
| Osage | 49.8 /100 | #175 | Average 11.7% |
| Peruvians | 49.3 /100 | #176 | Average 11.7% |
| Immigrants | Ukraine | 48.4 /100 | #177 | Average 11.8% |
| German Russians | 48.1 /100 | #178 | Average 11.8% |
| Immigrants | Kenya | 46.4 /100 | #179 | Average 11.8% |
| Uruguayans | 44.8 /100 | #180 | Average 11.8% |
| South American Indians | 41.7 /100 | #181 | Average 11.9% |