Swiss vs Immigrants from Austria Householder Income Ages 25 - 44 years
COMPARE
Swiss
Immigrants from Austria
Householder Income Ages 25 - 44 years
Householder Income Ages 25 - 44 years Comparison
Swiss
Immigrants from Austria
$95,511
HOUSEHOLDER INCOME AGES 25 - 44 YEARS
62.8/ 100
METRIC RATING
162nd/ 347
METRIC RANK
$106,103
HOUSEHOLDER INCOME AGES 25 - 44 YEARS
99.8/ 100
METRIC RATING
57th/ 347
METRIC RANK
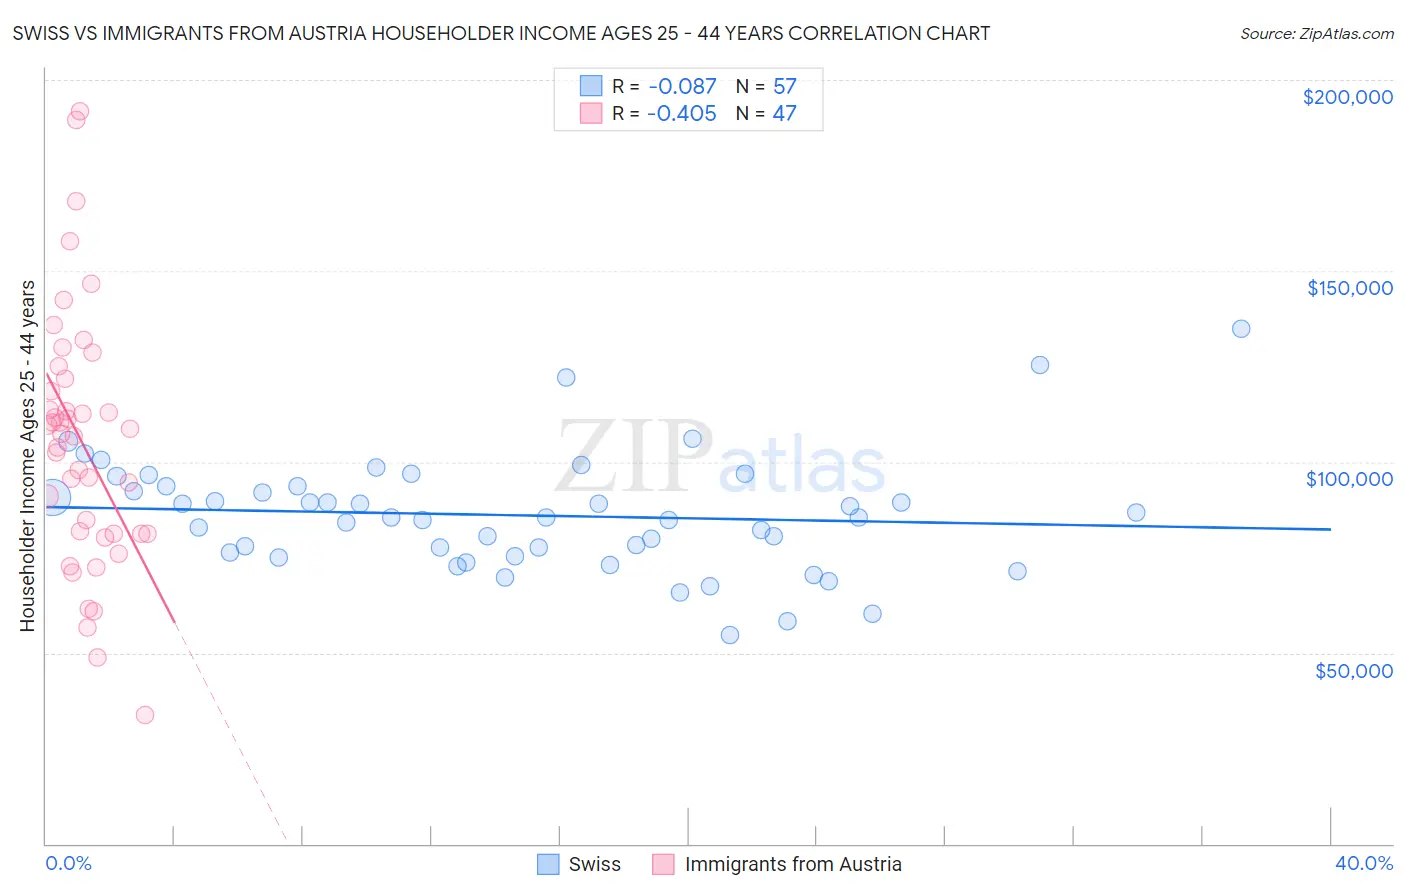
Swiss vs Immigrants from Austria Householder Income Ages 25 - 44 years Correlation Chart
The statistical analysis conducted on geographies consisting of 463,021,921 people shows a slight negative correlation between the proportion of Swiss and household income with householder between the ages 25 and 44 in the United States with a correlation coefficient (R) of -0.087 and weighted average of $95,511. Similarly, the statistical analysis conducted on geographies consisting of 167,639,704 people shows a moderate negative correlation between the proportion of Immigrants from Austria and household income with householder between the ages 25 and 44 in the United States with a correlation coefficient (R) of -0.405 and weighted average of $106,103, a difference of 11.1%.
Householder Income Ages 25 - 44 years Correlation Summary
| Measurement | Swiss | Immigrants from Austria |
| Minimum | $54,762 | $33,571 |
| Maximum | $135,000 | $191,842 |
| Range | $80,238 | $158,271 |
| Mean | $86,015 | $105,149 |
| Median | $85,408 | $107,519 |
| Interquartile 25% (IQ1) | $75,688 | $81,250 |
| Interquartile 75% (IQ3) | $93,608 | $121,802 |
| Interquartile Range (IQR) | $17,920 | $40,552 |
| Standard Deviation (Sample) | $15,233 | $33,347 |
| Standard Deviation (Population) | $15,098 | $32,991 |
Similar Demographics by Householder Income Ages 25 - 44 years
Demographics Similar to Swiss by Householder Income Ages 25 - 44 years
In terms of householder income ages 25 - 44 years, the demographic groups most similar to Swiss are Immigrants from Portugal ($95,512, a difference of 0.0%), Icelander ($95,560, a difference of 0.050%), Costa Rican ($95,565, a difference of 0.060%), Immigrants from Saudi Arabia ($95,450, a difference of 0.060%), and Scandinavian ($95,596, a difference of 0.090%).
| Demographics | Rating | Rank | Householder Income Ages 25 - 44 years |
| Moroccans | 70.3 /100 | #155 | Good $96,117 |
| Immigrants | Germany | 67.9 /100 | #156 | Good $95,913 |
| Immigrants | Uganda | 65.2 /100 | #157 | Good $95,698 |
| Scandinavians | 63.9 /100 | #158 | Good $95,596 |
| Costa Ricans | 63.5 /100 | #159 | Good $95,565 |
| Icelanders | 63.4 /100 | #160 | Good $95,560 |
| Immigrants | Portugal | 62.8 /100 | #161 | Good $95,512 |
| Swiss | 62.8 /100 | #162 | Good $95,511 |
| Immigrants | Saudi Arabia | 62.0 /100 | #163 | Good $95,450 |
| South Americans | 60.9 /100 | #164 | Good $95,362 |
| Immigrants | Nepal | 60.3 /100 | #165 | Good $95,322 |
| Immigrants | Ethiopia | 59.5 /100 | #166 | Average $95,256 |
| Czechoslovakians | 57.0 /100 | #167 | Average $95,070 |
| Alsatians | 56.8 /100 | #168 | Average $95,059 |
| Native Hawaiians | 56.8 /100 | #169 | Average $95,058 |
Demographics Similar to Immigrants from Austria by Householder Income Ages 25 - 44 years
In terms of householder income ages 25 - 44 years, the demographic groups most similar to Immigrants from Austria are Immigrants from Pakistan ($106,129, a difference of 0.030%), Greek ($106,457, a difference of 0.33%), Immigrants from South Africa ($105,748, a difference of 0.34%), Paraguayan ($106,615, a difference of 0.48%), and Immigrants from Norway ($106,629, a difference of 0.50%).
| Demographics | Rating | Rank | Householder Income Ages 25 - 44 years |
| Cambodians | 99.9 /100 | #50 | Exceptional $107,148 |
| Immigrants | Czechoslovakia | 99.9 /100 | #51 | Exceptional $106,888 |
| Immigrants | Europe | 99.9 /100 | #52 | Exceptional $106,817 |
| Immigrants | Norway | 99.9 /100 | #53 | Exceptional $106,629 |
| Paraguayans | 99.9 /100 | #54 | Exceptional $106,615 |
| Greeks | 99.9 /100 | #55 | Exceptional $106,457 |
| Immigrants | Pakistan | 99.8 /100 | #56 | Exceptional $106,129 |
| Immigrants | Austria | 99.8 /100 | #57 | Exceptional $106,103 |
| Immigrants | South Africa | 99.8 /100 | #58 | Exceptional $105,748 |
| Immigrants | Latvia | 99.8 /100 | #59 | Exceptional $105,522 |
| Egyptians | 99.7 /100 | #60 | Exceptional $105,282 |
| Lithuanians | 99.7 /100 | #61 | Exceptional $105,223 |
| Immigrants | Italy | 99.7 /100 | #62 | Exceptional $105,201 |
| Immigrants | Scotland | 99.7 /100 | #63 | Exceptional $105,089 |
| New Zealanders | 99.7 /100 | #64 | Exceptional $105,085 |