Swiss vs Scandinavian Single Mother Poverty
COMPARE
Swiss
Scandinavian
Single Mother Poverty
Single Mother Poverty Comparison
Swiss
Scandinavians
29.7%
SINGLE MOTHER POVERTY
17.2/ 100
METRIC RATING
203rd/ 347
METRIC RANK
28.9%
SINGLE MOTHER POVERTY
66.2/ 100
METRIC RATING
162nd/ 347
METRIC RANK
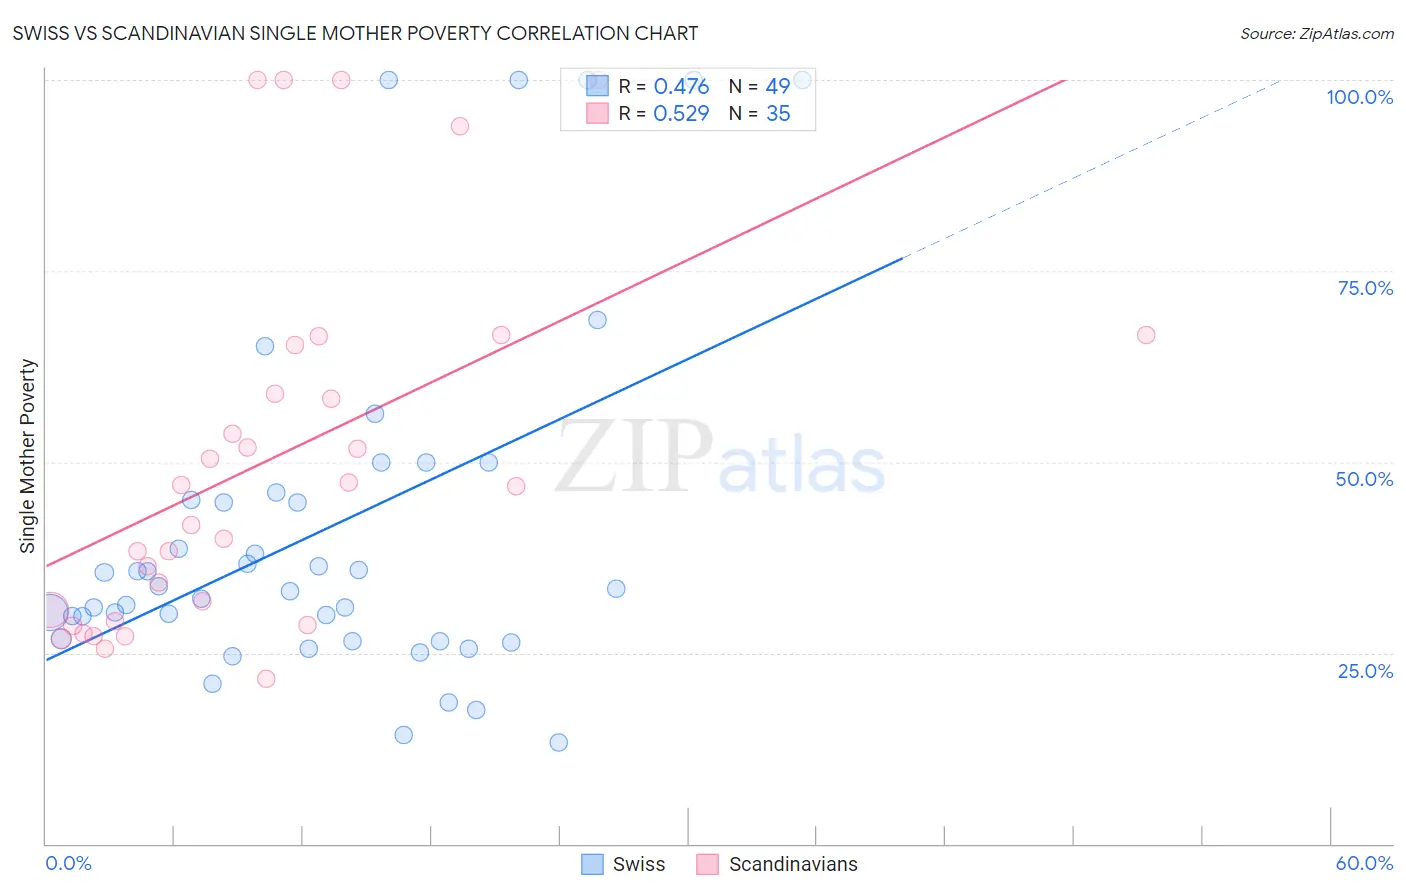
Swiss vs Scandinavian Single Mother Poverty Correlation Chart
The statistical analysis conducted on geographies consisting of 448,256,315 people shows a moderate positive correlation between the proportion of Swiss and poverty level among single mothers in the United States with a correlation coefficient (R) of 0.476 and weighted average of 29.7%. Similarly, the statistical analysis conducted on geographies consisting of 456,235,845 people shows a substantial positive correlation between the proportion of Scandinavians and poverty level among single mothers in the United States with a correlation coefficient (R) of 0.529 and weighted average of 28.9%, a difference of 2.7%.
Single Mother Poverty Correlation Summary
| Measurement | Swiss | Scandinavian |
| Minimum | 13.3% | 21.6% |
| Maximum | 100.0% | 100.0% |
| Range | 86.7% | 78.4% |
| Mean | 41.0% | 50.2% |
| Median | 33.3% | 46.8% |
| Interquartile 25% (IQ1) | 26.7% | 29.1% |
| Interquartile 75% (IQ3) | 45.5% | 65.3% |
| Interquartile Range (IQR) | 18.8% | 36.2% |
| Standard Deviation (Sample) | 23.1% | 24.0% |
| Standard Deviation (Population) | 22.8% | 23.7% |
Similar Demographics by Single Mother Poverty
Demographics Similar to Swiss by Single Mother Poverty
In terms of single mother poverty, the demographic groups most similar to Swiss are Malaysian (29.7%, a difference of 0.020%), Immigrants (29.7%, a difference of 0.050%), Czechoslovakian (29.7%, a difference of 0.10%), Belgian (29.7%, a difference of 0.12%), and Immigrants from Haiti (29.7%, a difference of 0.12%).
| Demographics | Rating | Rank | Single Mother Poverty |
| Spanish American Indians | 23.4 /100 | #196 | Fair 29.6% |
| Immigrants | Jamaica | 22.0 /100 | #197 | Fair 29.6% |
| Trinidadians and Tobagonians | 21.7 /100 | #198 | Fair 29.6% |
| Cubans | 20.8 /100 | #199 | Fair 29.6% |
| Panamanians | 20.0 /100 | #200 | Fair 29.6% |
| Belgians | 18.8 /100 | #201 | Poor 29.7% |
| Malaysians | 17.4 /100 | #202 | Poor 29.7% |
| Swiss | 17.2 /100 | #203 | Poor 29.7% |
| Immigrants | Immigrants | 16.6 /100 | #204 | Poor 29.7% |
| Czechoslovakians | 16.1 /100 | #205 | Poor 29.7% |
| Immigrants | Haiti | 15.8 /100 | #206 | Poor 29.7% |
| Immigrants | Panama | 15.5 /100 | #207 | Poor 29.8% |
| Immigrants | Guyana | 14.7 /100 | #208 | Poor 29.8% |
| Irish | 13.9 /100 | #209 | Poor 29.8% |
| Haitians | 13.3 /100 | #210 | Poor 29.8% |
Demographics Similar to Scandinavians by Single Mother Poverty
In terms of single mother poverty, the demographic groups most similar to Scandinavians are Immigrants from Cambodia (28.9%, a difference of 0.020%), Immigrants from Nigeria (28.9%, a difference of 0.020%), Immigrants from Kenya (28.9%, a difference of 0.020%), Japanese (28.9%, a difference of 0.10%), and Czech (28.9%, a difference of 0.12%).
| Demographics | Rating | Rank | Single Mother Poverty |
| Ugandans | 71.7 /100 | #155 | Good 28.8% |
| Iraqis | 71.5 /100 | #156 | Good 28.8% |
| Immigrants | Western Europe | 71.1 /100 | #157 | Good 28.9% |
| Immigrants | Hungary | 70.6 /100 | #158 | Good 28.9% |
| Czechs | 68.4 /100 | #159 | Good 28.9% |
| Japanese | 68.0 /100 | #160 | Good 28.9% |
| Immigrants | Cambodia | 66.6 /100 | #161 | Good 28.9% |
| Scandinavians | 66.2 /100 | #162 | Good 28.9% |
| Immigrants | Nigeria | 65.9 /100 | #163 | Good 28.9% |
| Immigrants | Kenya | 65.9 /100 | #164 | Good 28.9% |
| Arabs | 60.7 /100 | #165 | Good 29.0% |
| Inupiat | 60.4 /100 | #166 | Good 29.0% |
| Costa Ricans | 58.4 /100 | #167 | Average 29.0% |
| Europeans | 57.6 /100 | #168 | Average 29.1% |
| Immigrants | Uruguay | 57.2 /100 | #169 | Average 29.1% |