Sudanese vs Carpatho Rusyn Poverty
COMPARE
Sudanese
Carpatho Rusyn
Poverty
Poverty Comparison
Sudanese
Carpatho Rusyns
14.0%
POVERTY
0.3/ 100
METRIC RATING
243rd/ 347
METRIC RANK
11.3%
POVERTY
97.2/ 100
METRIC RATING
74th/ 347
METRIC RANK
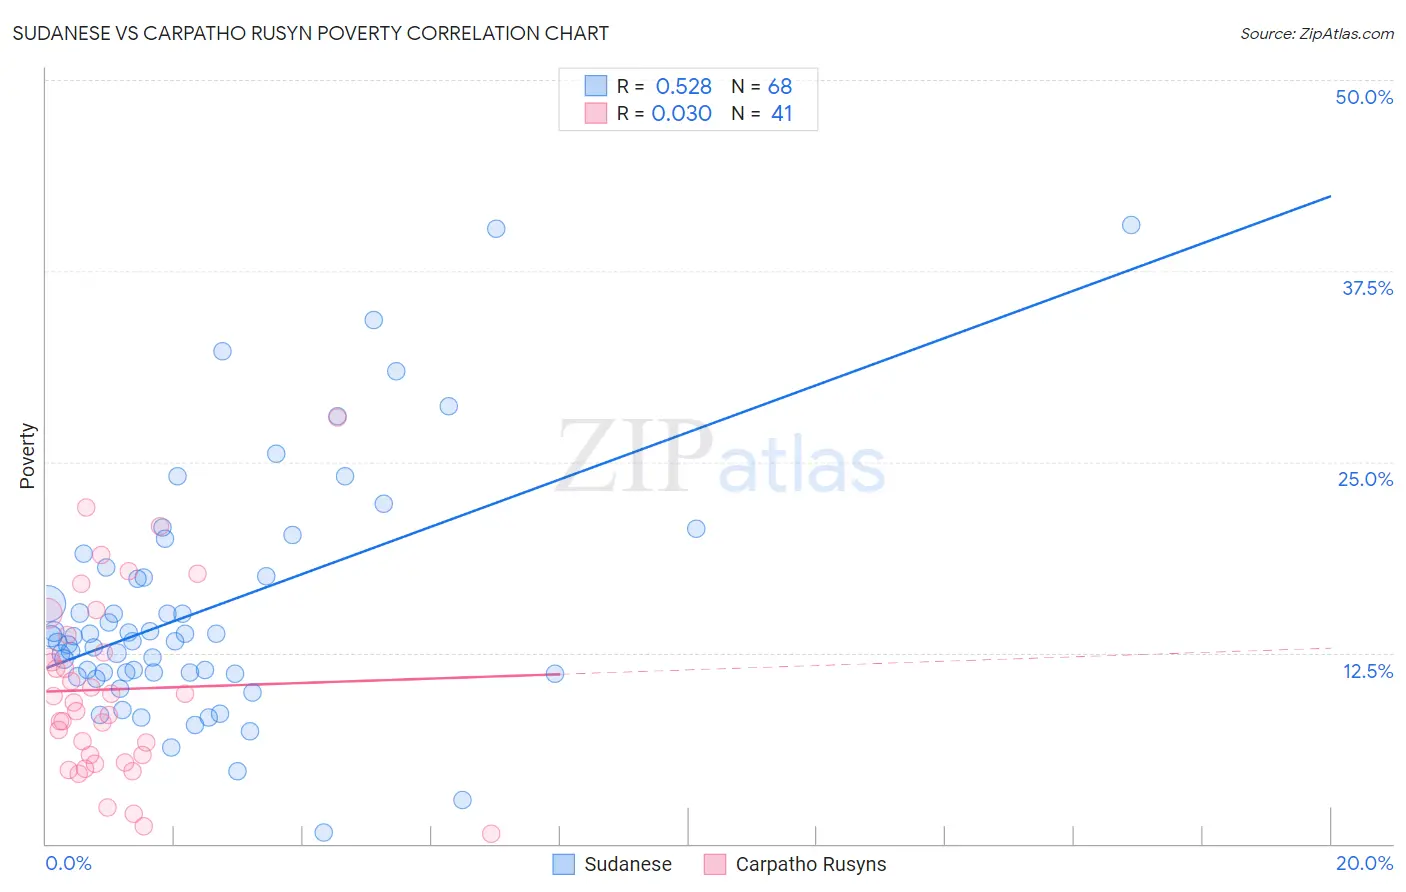
Sudanese vs Carpatho Rusyn Poverty Correlation Chart
The statistical analysis conducted on geographies consisting of 110,120,634 people shows a substantial positive correlation between the proportion of Sudanese and poverty level in the United States with a correlation coefficient (R) of 0.528 and weighted average of 14.0%. Similarly, the statistical analysis conducted on geographies consisting of 58,869,628 people shows no correlation between the proportion of Carpatho Rusyns and poverty level in the United States with a correlation coefficient (R) of 0.030 and weighted average of 11.3%, a difference of 24.5%.
Poverty Correlation Summary
| Measurement | Sudanese | Carpatho Rusyn |
| Minimum | 0.75% | 0.68% |
| Maximum | 40.5% | 27.9% |
| Range | 39.8% | 27.2% |
| Mean | 15.4% | 10.1% |
| Median | 13.4% | 9.2% |
| Interquartile 25% (IQ1) | 11.2% | 5.6% |
| Interquartile 75% (IQ3) | 17.8% | 13.1% |
| Interquartile Range (IQR) | 6.6% | 7.6% |
| Standard Deviation (Sample) | 7.9% | 6.0% |
| Standard Deviation (Population) | 7.8% | 5.9% |
Similar Demographics by Poverty
Demographics Similar to Sudanese by Poverty
In terms of poverty, the demographic groups most similar to Sudanese are Nepalese (14.0%, a difference of 0.030%), Ecuadorian (14.0%, a difference of 0.070%), Salvadoran (14.0%, a difference of 0.39%), Immigrants from Middle Africa (14.0%, a difference of 0.41%), and Immigrants from Sudan (14.1%, a difference of 0.42%).
| Demographics | Rating | Rank | Poverty |
| Immigrants | Armenia | 0.5 /100 | #236 | Tragic 13.9% |
| French American Indians | 0.5 /100 | #237 | Tragic 13.9% |
| Ghanaians | 0.5 /100 | #238 | Tragic 13.9% |
| Nicaraguans | 0.4 /100 | #239 | Tragic 13.9% |
| Immigrants | Middle Africa | 0.4 /100 | #240 | Tragic 14.0% |
| Salvadorans | 0.4 /100 | #241 | Tragic 14.0% |
| Ecuadorians | 0.4 /100 | #242 | Tragic 14.0% |
| Sudanese | 0.3 /100 | #243 | Tragic 14.0% |
| Nepalese | 0.3 /100 | #244 | Tragic 14.0% |
| Immigrants | Sudan | 0.3 /100 | #245 | Tragic 14.1% |
| Potawatomi | 0.3 /100 | #246 | Tragic 14.1% |
| Liberians | 0.2 /100 | #247 | Tragic 14.1% |
| Immigrants | Western Africa | 0.2 /100 | #248 | Tragic 14.1% |
| Immigrants | Ghana | 0.2 /100 | #249 | Tragic 14.2% |
| Cree | 0.2 /100 | #250 | Tragic 14.2% |
Demographics Similar to Carpatho Rusyns by Poverty
In terms of poverty, the demographic groups most similar to Carpatho Rusyns are European (11.3%, a difference of 0.050%), Immigrants from Belgium (11.3%, a difference of 0.050%), Zimbabwean (11.3%, a difference of 0.070%), Immigrants from Canada (11.3%, a difference of 0.090%), and Serbian (11.2%, a difference of 0.18%).
| Demographics | Rating | Rank | Poverty |
| Immigrants | Australia | 97.4 /100 | #67 | Exceptional 11.2% |
| Slovaks | 97.4 /100 | #68 | Exceptional 11.2% |
| Serbians | 97.4 /100 | #69 | Exceptional 11.2% |
| Immigrants | Canada | 97.3 /100 | #70 | Exceptional 11.3% |
| Zimbabweans | 97.3 /100 | #71 | Exceptional 11.3% |
| Europeans | 97.2 /100 | #72 | Exceptional 11.3% |
| Immigrants | Belgium | 97.2 /100 | #73 | Exceptional 11.3% |
| Carpatho Rusyns | 97.2 /100 | #74 | Exceptional 11.3% |
| Immigrants | Eastern Europe | 97.0 /100 | #75 | Exceptional 11.3% |
| Immigrants | North America | 96.8 /100 | #76 | Exceptional 11.3% |
| Immigrants | Eastern Asia | 96.7 /100 | #77 | Exceptional 11.3% |
| Dutch | 96.7 /100 | #78 | Exceptional 11.3% |
| Cambodians | 96.7 /100 | #79 | Exceptional 11.3% |
| Indians (Asian) | 96.6 /100 | #80 | Exceptional 11.3% |
| Irish | 96.6 /100 | #81 | Exceptional 11.3% |