Sudanese vs Carpatho Rusyn 12th Grade, No Diploma
COMPARE
Sudanese
Carpatho Rusyn
12th Grade, No Diploma
12th Grade, No Diploma Comparison
Sudanese
Carpatho Rusyns
91.0%
12TH GRADE, NO DIPLOMA
34.4/ 100
METRIC RATING
185th/ 347
METRIC RANK
93.6%
12TH GRADE, NO DIPLOMA
100.0/ 100
METRIC RATING
5th/ 347
METRIC RANK
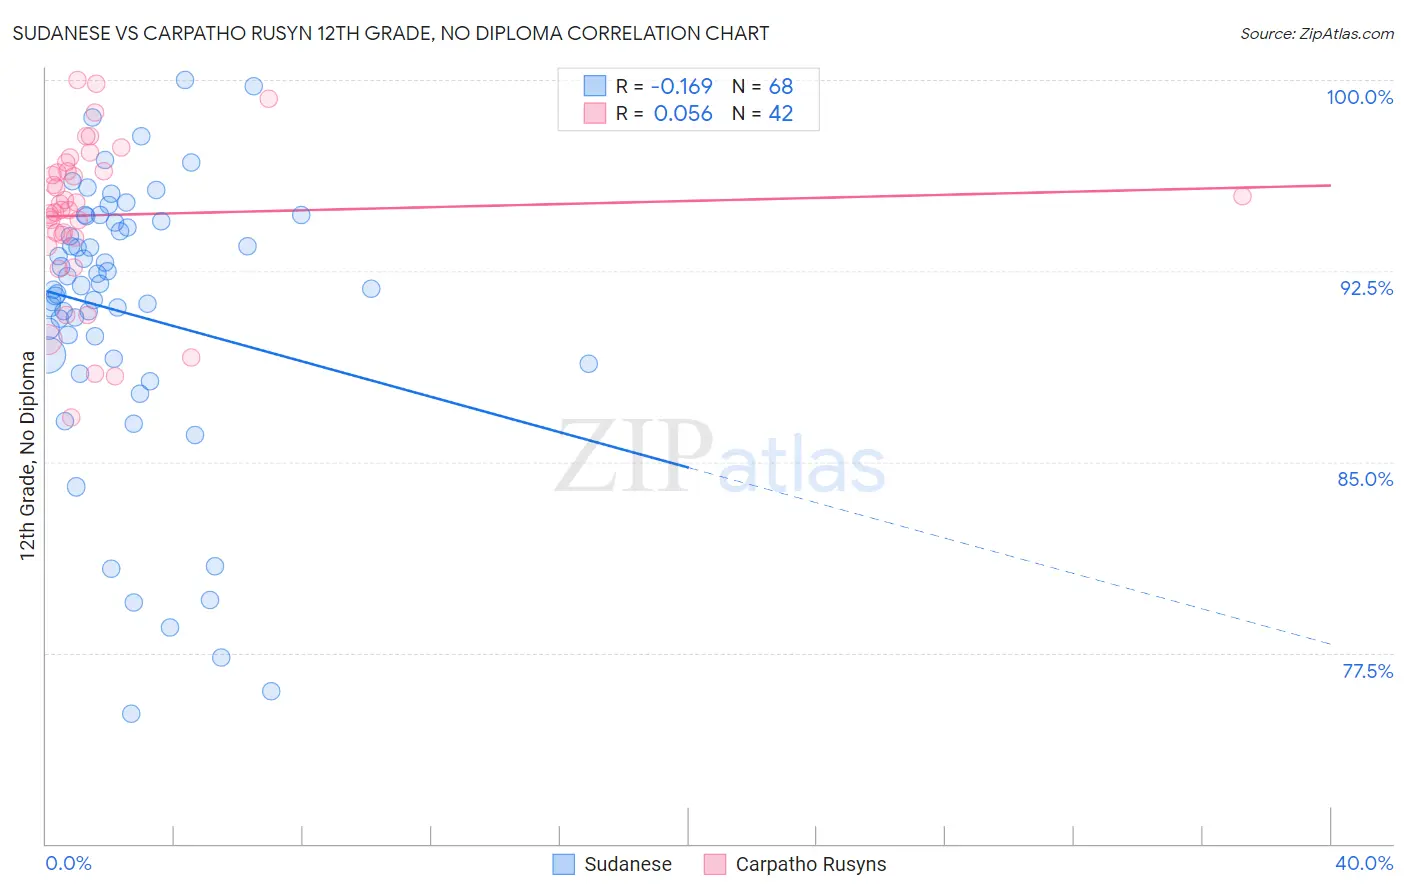
Sudanese vs Carpatho Rusyn 12th Grade, No Diploma Correlation Chart
The statistical analysis conducted on geographies consisting of 110,147,806 people shows a poor negative correlation between the proportion of Sudanese and percentage of population with at least 12th grade (no diploma) education in the United States with a correlation coefficient (R) of -0.169 and weighted average of 91.0%. Similarly, the statistical analysis conducted on geographies consisting of 58,871,690 people shows a slight positive correlation between the proportion of Carpatho Rusyns and percentage of population with at least 12th grade (no diploma) education in the United States with a correlation coefficient (R) of 0.056 and weighted average of 93.6%, a difference of 2.9%.
12th Grade, No Diploma Correlation Summary
| Measurement | Sudanese | Carpatho Rusyn |
| Minimum | 75.1% | 86.7% |
| Maximum | 100.0% | 100.0% |
| Range | 24.9% | 13.3% |
| Mean | 90.8% | 94.7% |
| Median | 91.9% | 95.0% |
| Interquartile 25% (IQ1) | 89.1% | 93.8% |
| Interquartile 75% (IQ3) | 94.4% | 96.4% |
| Interquartile Range (IQR) | 5.3% | 2.6% |
| Standard Deviation (Sample) | 5.5% | 3.1% |
| Standard Deviation (Population) | 5.5% | 3.1% |
Similar Demographics by 12th Grade, No Diploma
Demographics Similar to Sudanese by 12th Grade, No Diploma
In terms of 12th grade, no diploma, the demographic groups most similar to Sudanese are Ethiopian (91.0%, a difference of 0.010%), Spaniard (91.0%, a difference of 0.020%), Potawatomi (91.0%, a difference of 0.020%), American (91.0%, a difference of 0.030%), and Immigrants from Uganda (90.9%, a difference of 0.040%).
| Demographics | Rating | Rank | 12th Grade, No Diploma |
| Spanish | 43.7 /100 | #178 | Average 91.1% |
| Immigrants | Chile | 43.3 /100 | #179 | Average 91.1% |
| Immigrants | Syria | 40.3 /100 | #180 | Average 91.1% |
| Guamanians/Chamorros | 39.5 /100 | #181 | Fair 91.0% |
| Immigrants | Nonimmigrants | 38.8 /100 | #182 | Fair 91.0% |
| Osage | 38.3 /100 | #183 | Fair 91.0% |
| Spaniards | 36.2 /100 | #184 | Fair 91.0% |
| Sudanese | 34.4 /100 | #185 | Fair 91.0% |
| Ethiopians | 33.9 /100 | #186 | Fair 91.0% |
| Potawatomi | 32.9 /100 | #187 | Fair 91.0% |
| Americans | 32.6 /100 | #188 | Fair 91.0% |
| Immigrants | Uganda | 31.6 /100 | #189 | Fair 90.9% |
| Afghans | 29.9 /100 | #190 | Fair 90.9% |
| Moroccans | 28.8 /100 | #191 | Fair 90.9% |
| Immigrants | Eastern Africa | 27.7 /100 | #192 | Fair 90.9% |
Demographics Similar to Carpatho Rusyns by 12th Grade, No Diploma
In terms of 12th grade, no diploma, the demographic groups most similar to Carpatho Rusyns are Slovene (93.6%, a difference of 0.010%), Immigrants from India (93.6%, a difference of 0.010%), Lithuanian (93.6%, a difference of 0.020%), Slovak (93.6%, a difference of 0.050%), and Chinese (93.6%, a difference of 0.060%).
| Demographics | Rating | Rank | 12th Grade, No Diploma |
| Norwegians | 100.0 /100 | #1 | Exceptional 94.0% |
| Swedes | 100.0 /100 | #2 | Exceptional 93.7% |
| Lithuanians | 100.0 /100 | #3 | Exceptional 93.6% |
| Slovenes | 100.0 /100 | #4 | Exceptional 93.6% |
| Carpatho Rusyns | 100.0 /100 | #5 | Exceptional 93.6% |
| Immigrants | India | 100.0 /100 | #6 | Exceptional 93.6% |
| Slovaks | 100.0 /100 | #7 | Exceptional 93.6% |
| Chinese | 100.0 /100 | #8 | Exceptional 93.6% |
| Latvians | 100.0 /100 | #9 | Exceptional 93.6% |
| Croatians | 100.0 /100 | #10 | Exceptional 93.5% |
| Poles | 100.0 /100 | #11 | Exceptional 93.5% |
| Eastern Europeans | 100.0 /100 | #12 | Exceptional 93.5% |
| Danes | 100.0 /100 | #13 | Exceptional 93.5% |
| Bulgarians | 100.0 /100 | #14 | Exceptional 93.5% |
| Finns | 100.0 /100 | #15 | Exceptional 93.4% |