Subsaharan African vs Cheyenne Single Father Poverty
COMPARE
Subsaharan African
Cheyenne
Single Father Poverty
Single Father Poverty Comparison
Sub-Saharan Africans
Cheyenne
16.9%
SINGLE FATHER POVERTY
2.9/ 100
METRIC RATING
237th/ 347
METRIC RANK
16.7%
SINGLE FATHER POVERTY
9.3/ 100
METRIC RATING
217th/ 347
METRIC RANK
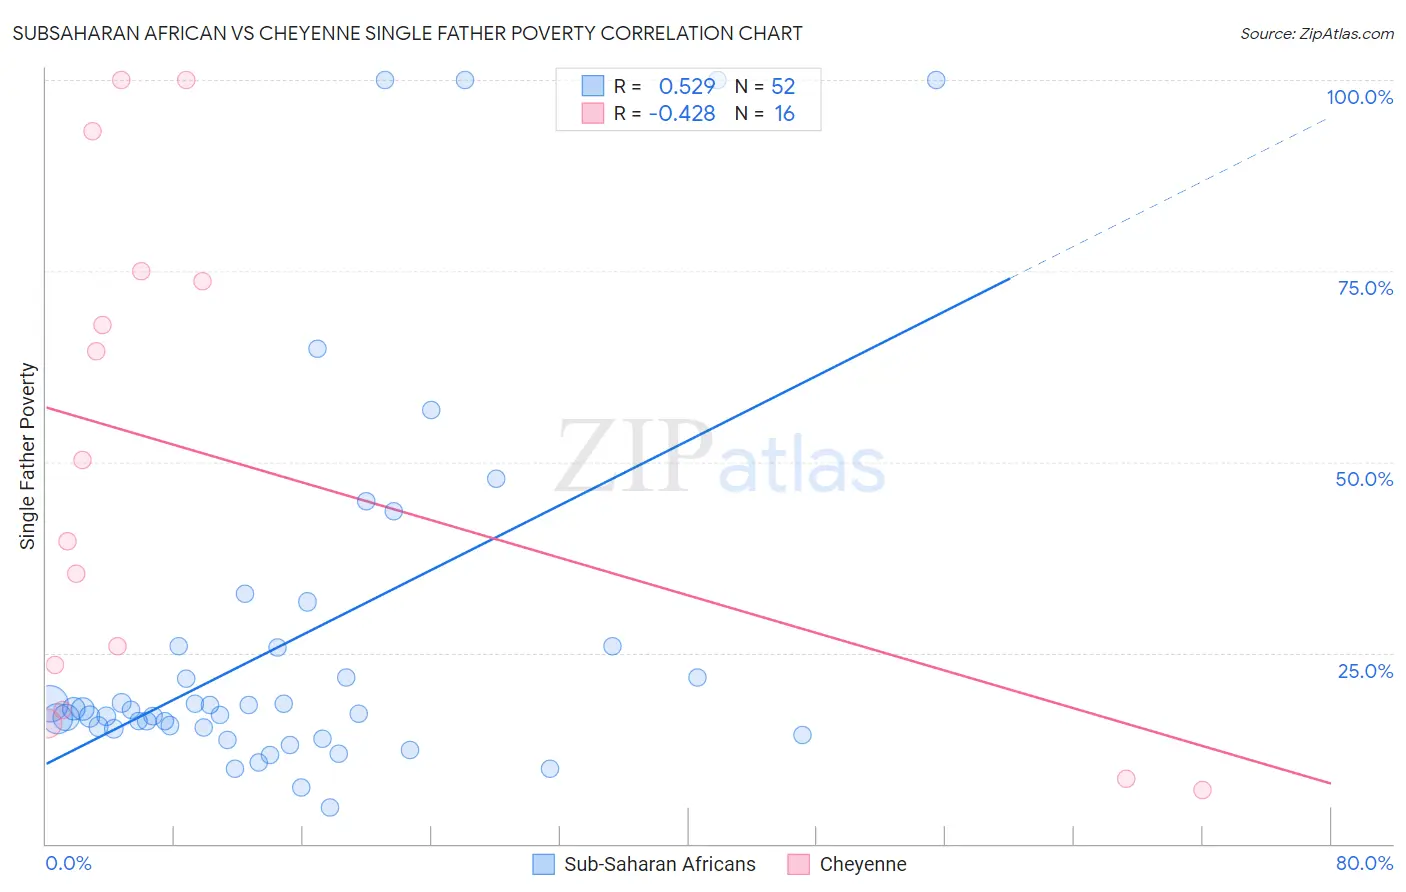
Subsaharan African vs Cheyenne Single Father Poverty Correlation Chart
The statistical analysis conducted on geographies consisting of 386,638,837 people shows a substantial positive correlation between the proportion of Sub-Saharan Africans and poverty level among single fathers in the United States with a correlation coefficient (R) of 0.529 and weighted average of 16.9%. Similarly, the statistical analysis conducted on geographies consisting of 74,941,961 people shows a moderate negative correlation between the proportion of Cheyenne and poverty level among single fathers in the United States with a correlation coefficient (R) of -0.428 and weighted average of 16.7%, a difference of 1.3%.
Single Father Poverty Correlation Summary
| Measurement | Subsaharan African | Cheyenne |
| Minimum | 4.8% | 7.0% |
| Maximum | 100.0% | 100.0% |
| Range | 95.2% | 93.0% |
| Mean | 26.7% | 49.9% |
| Median | 17.3% | 45.0% |
| Interquartile 25% (IQ1) | 15.1% | 20.4% |
| Interquartile 75% (IQ3) | 25.8% | 74.3% |
| Interquartile Range (IQR) | 10.6% | 53.9% |
| Standard Deviation (Sample) | 24.4% | 32.7% |
| Standard Deviation (Population) | 24.1% | 31.6% |
Demographics Similar to Sub-Saharan Africans and Cheyenne by Single Father Poverty
In terms of single father poverty, the demographic groups most similar to Sub-Saharan Africans are Immigrants from Western Europe (16.9%, a difference of 0.0%), Immigrants from Germany (16.9%, a difference of 0.0%), Marshallese (16.9%, a difference of 0.10%), Senegalese (16.9%, a difference of 0.13%), and Immigrants from Grenada (16.9%, a difference of 0.27%). Similarly, the demographic groups most similar to Cheyenne are Immigrants from Uganda (16.7%, a difference of 0.10%), Immigrants from Ghana (16.7%, a difference of 0.16%), Immigrants from Denmark (16.7%, a difference of 0.17%), Immigrants from Greece (16.7%, a difference of 0.17%), and Immigrants from Spain (16.7%, a difference of 0.17%).
| Demographics | Rating | Rank | Single Father Poverty |
| Cheyenne | 9.3 /100 | #217 | Tragic 16.7% |
| Immigrants | Uganda | 8.6 /100 | #218 | Tragic 16.7% |
| Immigrants | Ghana | 8.1 /100 | #219 | Tragic 16.7% |
| Immigrants | Denmark | 8.1 /100 | #220 | Tragic 16.7% |
| Immigrants | Greece | 8.1 /100 | #221 | Tragic 16.7% |
| Immigrants | Spain | 8.0 /100 | #222 | Tragic 16.7% |
| Immigrants | Austria | 7.0 /100 | #223 | Tragic 16.8% |
| Immigrants | Norway | 6.5 /100 | #224 | Tragic 16.8% |
| Menominee | 6.4 /100 | #225 | Tragic 16.8% |
| Hispanics or Latinos | 6.1 /100 | #226 | Tragic 16.8% |
| British | 5.6 /100 | #227 | Tragic 16.8% |
| Belgians | 5.3 /100 | #228 | Tragic 16.8% |
| Israelis | 4.6 /100 | #229 | Tragic 16.8% |
| Immigrants | Trinidad and Tobago | 4.5 /100 | #230 | Tragic 16.8% |
| Spanish Americans | 3.7 /100 | #231 | Tragic 16.9% |
| Immigrants | Grenada | 3.7 /100 | #232 | Tragic 16.9% |
| Senegalese | 3.2 /100 | #233 | Tragic 16.9% |
| Marshallese | 3.1 /100 | #234 | Tragic 16.9% |
| Immigrants | Western Europe | 2.9 /100 | #235 | Tragic 16.9% |
| Immigrants | Germany | 2.9 /100 | #236 | Tragic 16.9% |
| Sub-Saharan Africans | 2.9 /100 | #237 | Tragic 16.9% |