American vs Cheyenne Child Poverty Among Girls Under 16
COMPARE
American
Cheyenne
Child Poverty Among Girls Under 16
Child Poverty Among Girls Under 16 Comparison
Americans
Cheyenne
18.8%
CHILD POVERTY AMONG GIRLS UNDER 16
0.8/ 100
METRIC RATING
241st/ 347
METRIC RANK
26.3%
CHILD POVERTY AMONG GIRLS UNDER 16
0.0/ 100
METRIC RATING
338th/ 347
METRIC RANK
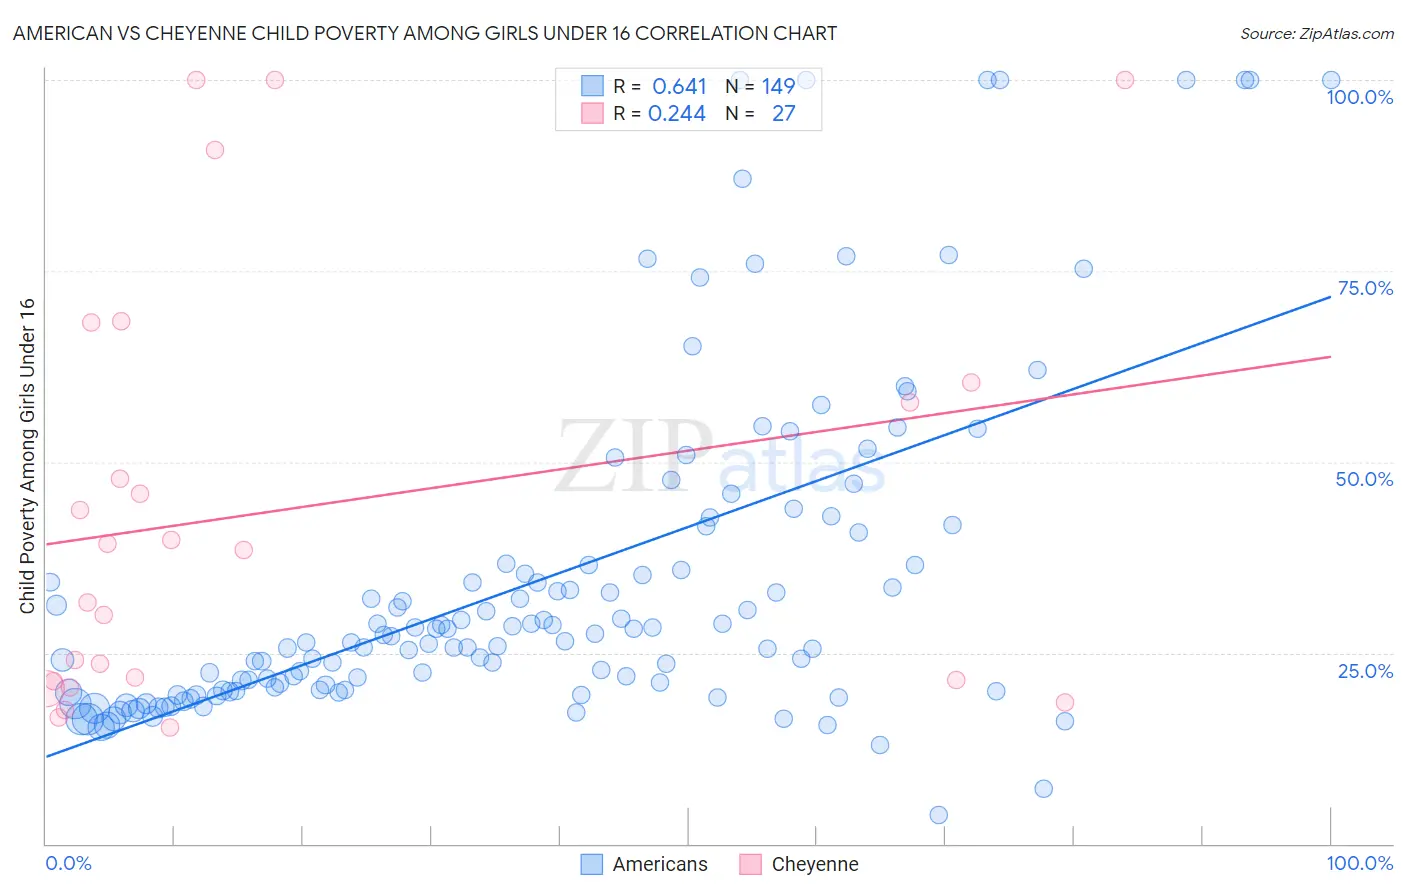
American vs Cheyenne Child Poverty Among Girls Under 16 Correlation Chart
The statistical analysis conducted on geographies consisting of 557,572,763 people shows a significant positive correlation between the proportion of Americans and poverty level among girls under the age of 16 in the United States with a correlation coefficient (R) of 0.641 and weighted average of 18.8%. Similarly, the statistical analysis conducted on geographies consisting of 80,342,731 people shows a weak positive correlation between the proportion of Cheyenne and poverty level among girls under the age of 16 in the United States with a correlation coefficient (R) of 0.244 and weighted average of 26.3%, a difference of 40.0%.
Child Poverty Among Girls Under 16 Correlation Summary
| Measurement | American | Cheyenne |
| Minimum | 3.7% | 15.2% |
| Maximum | 100.0% | 100.0% |
| Range | 96.3% | 84.8% |
| Mean | 34.4% | 43.8% |
| Median | 26.6% | 38.5% |
| Interquartile 25% (IQ1) | 20.0% | 21.3% |
| Interquartile 75% (IQ3) | 36.6% | 60.4% |
| Interquartile Range (IQR) | 16.5% | 39.1% |
| Standard Deviation (Sample) | 21.9% | 27.8% |
| Standard Deviation (Population) | 21.9% | 27.3% |
Similar Demographics by Child Poverty Among Girls Under 16
Demographics Similar to Americans by Child Poverty Among Girls Under 16
In terms of child poverty among girls under 16, the demographic groups most similar to Americans are Immigrants from Cuba (18.8%, a difference of 0.14%), Nigerian (18.7%, a difference of 0.32%), Immigrants from Nicaragua (18.8%, a difference of 0.36%), Ecuadorian (18.8%, a difference of 0.43%), and Marshallese (18.7%, a difference of 0.47%).
| Demographics | Rating | Rank | Child Poverty Among Girls Under 16 |
| Fijians | 1.1 /100 | #234 | Tragic 18.6% |
| Nepalese | 1.1 /100 | #235 | Tragic 18.6% |
| Alsatians | 1.1 /100 | #236 | Tragic 18.6% |
| Immigrants | Nigeria | 1.0 /100 | #237 | Tragic 18.6% |
| Immigrants | Eritrea | 1.0 /100 | #238 | Tragic 18.7% |
| Marshallese | 0.9 /100 | #239 | Tragic 18.7% |
| Nigerians | 0.9 /100 | #240 | Tragic 18.7% |
| Americans | 0.8 /100 | #241 | Tragic 18.8% |
| Immigrants | Cuba | 0.7 /100 | #242 | Tragic 18.8% |
| Immigrants | Nicaragua | 0.7 /100 | #243 | Tragic 18.8% |
| Ecuadorians | 0.7 /100 | #244 | Tragic 18.8% |
| Shoshone | 0.6 /100 | #245 | Tragic 18.9% |
| Immigrants | Laos | 0.6 /100 | #246 | Tragic 18.9% |
| Immigrants | Ghana | 0.5 /100 | #247 | Tragic 18.9% |
| French American Indians | 0.3 /100 | #248 | Tragic 19.2% |
Demographics Similar to Cheyenne by Child Poverty Among Girls Under 16
In terms of child poverty among girls under 16, the demographic groups most similar to Cheyenne are Crow (26.4%, a difference of 0.34%), Yup'ik (25.8%, a difference of 1.8%), Sioux (25.6%, a difference of 2.7%), Yuman (27.1%, a difference of 3.1%), and Pueblo (25.2%, a difference of 4.3%).
| Demographics | Rating | Rank | Child Poverty Among Girls Under 16 |
| Apache | 0.0 /100 | #331 | Tragic 23.8% |
| Natives/Alaskans | 0.0 /100 | #332 | Tragic 24.0% |
| Blacks/African Americans | 0.0 /100 | #333 | Tragic 24.7% |
| Menominee | 0.0 /100 | #334 | Tragic 25.0% |
| Pueblo | 0.0 /100 | #335 | Tragic 25.2% |
| Sioux | 0.0 /100 | #336 | Tragic 25.6% |
| Yup'ik | 0.0 /100 | #337 | Tragic 25.8% |
| Cheyenne | 0.0 /100 | #338 | Tragic 26.3% |
| Crow | 0.0 /100 | #339 | Tragic 26.4% |
| Yuman | 0.0 /100 | #340 | Tragic 27.1% |
| Hopi | 0.0 /100 | #341 | Tragic 27.9% |
| Pima | 0.0 /100 | #342 | Tragic 28.2% |
| Immigrants | Yemen | 0.0 /100 | #343 | Tragic 29.5% |
| Navajo | 0.0 /100 | #344 | Tragic 30.5% |
| Lumbee | 0.0 /100 | #345 | Tragic 30.7% |