Spanish American vs Cherokee Family Poverty
COMPARE
Spanish American
Cherokee
Family Poverty
Family Poverty Comparison
Spanish Americans
Cherokee
11.2%
FAMILY POVERTY
0.1/ 100
METRIC RATING
274th/ 347
METRIC RANK
10.6%
FAMILY POVERTY
0.5/ 100
METRIC RATING
246th/ 347
METRIC RANK
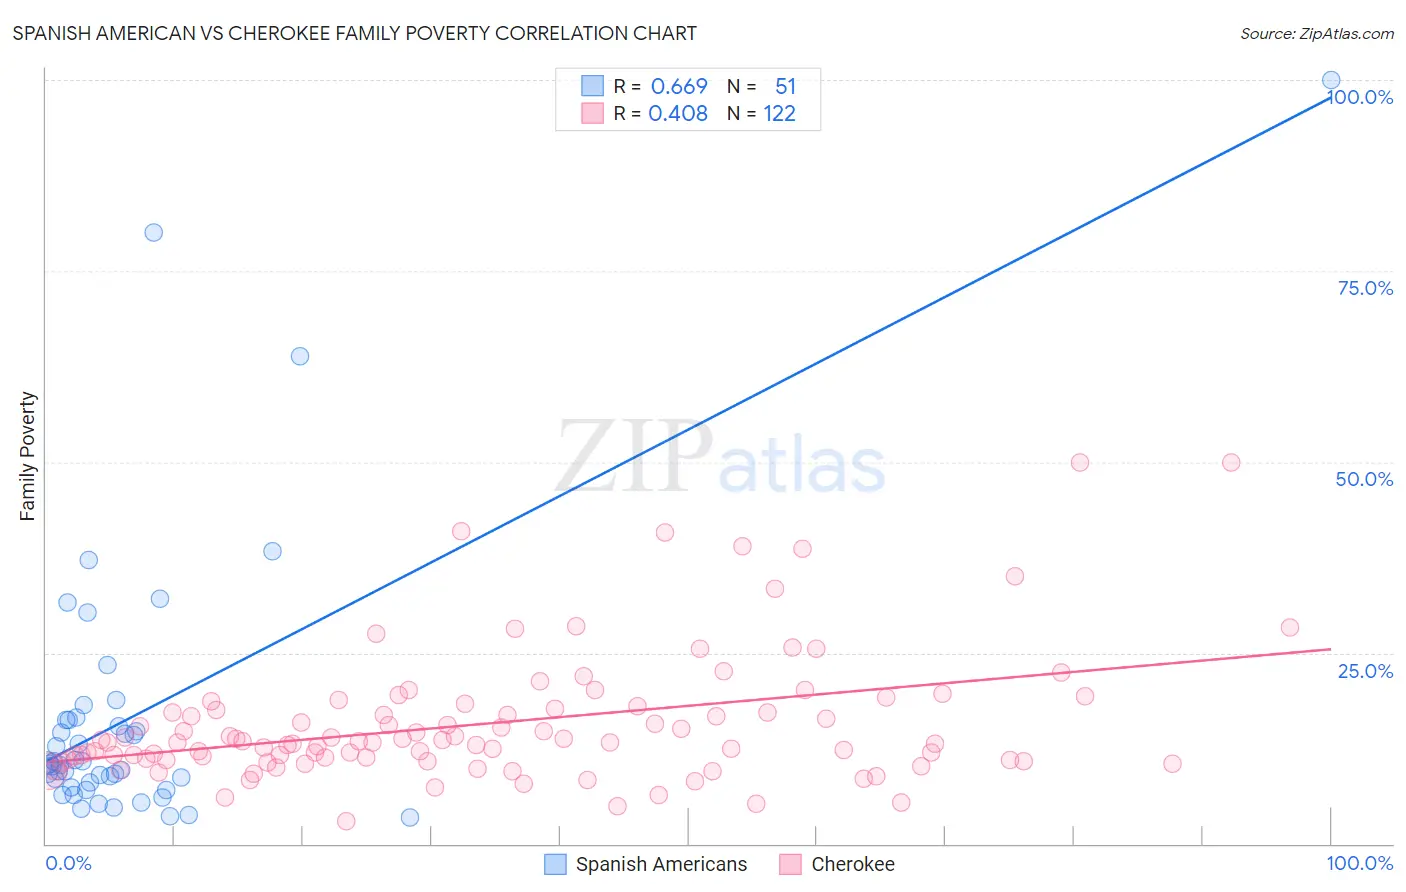
Spanish American vs Cherokee Family Poverty Correlation Chart
The statistical analysis conducted on geographies consisting of 103,138,189 people shows a significant positive correlation between the proportion of Spanish Americans and poverty level among families in the United States with a correlation coefficient (R) of 0.669 and weighted average of 11.2%. Similarly, the statistical analysis conducted on geographies consisting of 492,113,161 people shows a moderate positive correlation between the proportion of Cherokee and poverty level among families in the United States with a correlation coefficient (R) of 0.408 and weighted average of 10.6%, a difference of 5.9%.
Family Poverty Correlation Summary
| Measurement | Spanish American | Cherokee |
| Minimum | 3.4% | 2.9% |
| Maximum | 100.0% | 50.0% |
| Range | 96.6% | 47.1% |
| Mean | 16.8% | 15.7% |
| Median | 10.5% | 13.3% |
| Interquartile 25% (IQ1) | 7.4% | 10.9% |
| Interquartile 75% (IQ3) | 16.2% | 17.6% |
| Interquartile Range (IQR) | 8.8% | 6.7% |
| Standard Deviation (Sample) | 18.6% | 8.5% |
| Standard Deviation (Population) | 18.4% | 8.4% |
Similar Demographics by Family Poverty
Demographics Similar to Spanish Americans by Family Poverty
In terms of family poverty, the demographic groups most similar to Spanish Americans are Central American (11.2%, a difference of 0.050%), Immigrants from Guyana (11.2%, a difference of 0.070%), Somali (11.2%, a difference of 0.090%), Chippewa (11.2%, a difference of 0.16%), and Guyanese (11.2%, a difference of 0.19%).
| Demographics | Rating | Rank | Family Poverty |
| Comanche | 0.1 /100 | #267 | Tragic 11.0% |
| Jamaicans | 0.1 /100 | #268 | Tragic 11.1% |
| Immigrants | Ecuador | 0.1 /100 | #269 | Tragic 11.1% |
| Immigrants | Nicaragua | 0.1 /100 | #270 | Tragic 11.1% |
| Immigrants | Bahamas | 0.1 /100 | #271 | Tragic 11.1% |
| Immigrants | Jamaica | 0.1 /100 | #272 | Tragic 11.2% |
| Somalis | 0.1 /100 | #273 | Tragic 11.2% |
| Spanish Americans | 0.1 /100 | #274 | Tragic 11.2% |
| Central Americans | 0.1 /100 | #275 | Tragic 11.2% |
| Immigrants | Guyana | 0.1 /100 | #276 | Tragic 11.2% |
| Chippewa | 0.1 /100 | #277 | Tragic 11.2% |
| Guyanese | 0.1 /100 | #278 | Tragic 11.2% |
| Blackfeet | 0.0 /100 | #279 | Tragic 11.3% |
| Belizeans | 0.0 /100 | #280 | Tragic 11.3% |
| Immigrants | West Indies | 0.0 /100 | #281 | Tragic 11.3% |
Demographics Similar to Cherokee by Family Poverty
In terms of family poverty, the demographic groups most similar to Cherokee are Liberian (10.6%, a difference of 0.090%), Nicaraguan (10.6%, a difference of 0.29%), Cuban (10.6%, a difference of 0.34%), Immigrants from Burma/Myanmar (10.5%, a difference of 0.64%), and Salvadoran (10.7%, a difference of 0.87%).
| Demographics | Rating | Rank | Family Poverty |
| Potawatomi | 1.5 /100 | #239 | Tragic 10.2% |
| Immigrants | Azores | 1.4 /100 | #240 | Tragic 10.3% |
| Ghanaians | 1.3 /100 | #241 | Tragic 10.3% |
| Alaska Natives | 1.0 /100 | #242 | Tragic 10.4% |
| Nepalese | 0.8 /100 | #243 | Tragic 10.4% |
| Cree | 0.7 /100 | #244 | Tragic 10.5% |
| Immigrants | Burma/Myanmar | 0.6 /100 | #245 | Tragic 10.5% |
| Cherokee | 0.5 /100 | #246 | Tragic 10.6% |
| Liberians | 0.4 /100 | #247 | Tragic 10.6% |
| Nicaraguans | 0.4 /100 | #248 | Tragic 10.6% |
| Cubans | 0.4 /100 | #249 | Tragic 10.6% |
| Salvadorans | 0.3 /100 | #250 | Tragic 10.7% |
| Iroquois | 0.3 /100 | #251 | Tragic 10.7% |
| Immigrants | Zaire | 0.3 /100 | #252 | Tragic 10.7% |
| Immigrants | Western Africa | 0.3 /100 | #253 | Tragic 10.7% |