Spanish American vs Bolivian Family Poverty
COMPARE
Spanish American
Bolivian
Family Poverty
Family Poverty Comparison
Spanish Americans
Bolivians
11.2%
FAMILY POVERTY
0.1/ 100
METRIC RATING
274th/ 347
METRIC RANK
7.5%
FAMILY POVERTY
99.3/ 100
METRIC RATING
38th/ 347
METRIC RANK
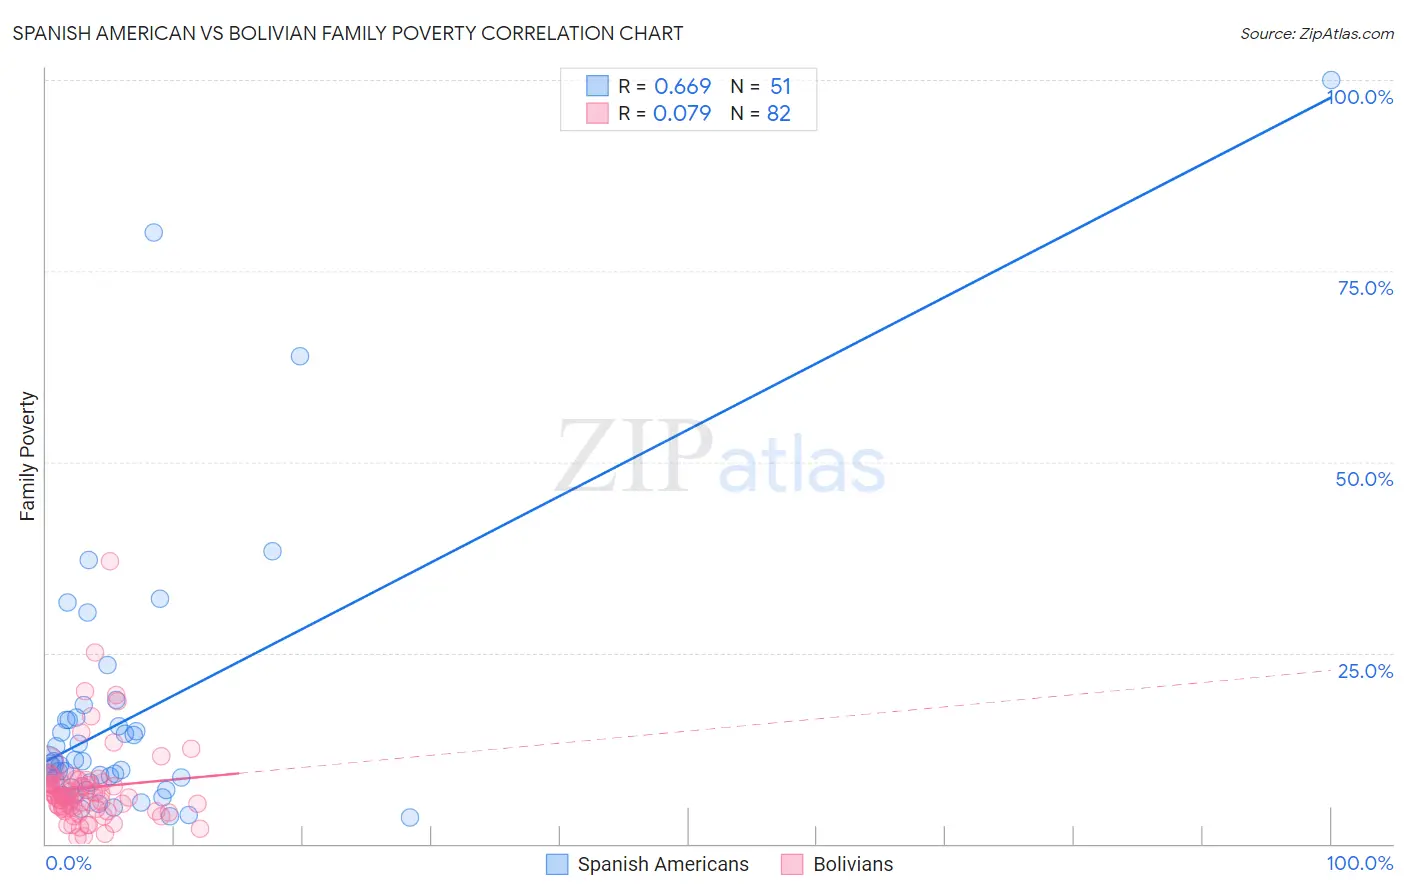
Spanish American vs Bolivian Family Poverty Correlation Chart
The statistical analysis conducted on geographies consisting of 103,138,189 people shows a significant positive correlation between the proportion of Spanish Americans and poverty level among families in the United States with a correlation coefficient (R) of 0.669 and weighted average of 11.2%. Similarly, the statistical analysis conducted on geographies consisting of 184,453,114 people shows a slight positive correlation between the proportion of Bolivians and poverty level among families in the United States with a correlation coefficient (R) of 0.079 and weighted average of 7.5%, a difference of 48.8%.
Family Poverty Correlation Summary
| Measurement | Spanish American | Bolivian |
| Minimum | 3.4% | 0.79% |
| Maximum | 100.0% | 36.9% |
| Range | 96.6% | 36.2% |
| Mean | 16.8% | 7.3% |
| Median | 10.5% | 6.3% |
| Interquartile 25% (IQ1) | 7.4% | 4.8% |
| Interquartile 75% (IQ3) | 16.2% | 8.0% |
| Interquartile Range (IQR) | 8.8% | 3.2% |
| Standard Deviation (Sample) | 18.6% | 5.4% |
| Standard Deviation (Population) | 18.4% | 5.4% |
Similar Demographics by Family Poverty
Demographics Similar to Spanish Americans by Family Poverty
In terms of family poverty, the demographic groups most similar to Spanish Americans are Central American (11.2%, a difference of 0.050%), Immigrants from Guyana (11.2%, a difference of 0.070%), Somali (11.2%, a difference of 0.090%), Chippewa (11.2%, a difference of 0.16%), and Guyanese (11.2%, a difference of 0.19%).
| Demographics | Rating | Rank | Family Poverty |
| Comanche | 0.1 /100 | #267 | Tragic 11.0% |
| Jamaicans | 0.1 /100 | #268 | Tragic 11.1% |
| Immigrants | Ecuador | 0.1 /100 | #269 | Tragic 11.1% |
| Immigrants | Nicaragua | 0.1 /100 | #270 | Tragic 11.1% |
| Immigrants | Bahamas | 0.1 /100 | #271 | Tragic 11.1% |
| Immigrants | Jamaica | 0.1 /100 | #272 | Tragic 11.2% |
| Somalis | 0.1 /100 | #273 | Tragic 11.2% |
| Spanish Americans | 0.1 /100 | #274 | Tragic 11.2% |
| Central Americans | 0.1 /100 | #275 | Tragic 11.2% |
| Immigrants | Guyana | 0.1 /100 | #276 | Tragic 11.2% |
| Chippewa | 0.1 /100 | #277 | Tragic 11.2% |
| Guyanese | 0.1 /100 | #278 | Tragic 11.2% |
| Blackfeet | 0.0 /100 | #279 | Tragic 11.3% |
| Belizeans | 0.0 /100 | #280 | Tragic 11.3% |
| Immigrants | West Indies | 0.0 /100 | #281 | Tragic 11.3% |
Demographics Similar to Bolivians by Family Poverty
In terms of family poverty, the demographic groups most similar to Bolivians are Carpatho Rusyn (7.5%, a difference of 0.060%), Slovene (7.5%, a difference of 0.10%), Estonian (7.5%, a difference of 0.24%), Immigrants from Australia (7.6%, a difference of 0.40%), and Turkish (7.5%, a difference of 0.41%).
| Demographics | Rating | Rank | Family Poverty |
| Czechs | 99.6 /100 | #31 | Exceptional 7.4% |
| Poles | 99.5 /100 | #32 | Exceptional 7.4% |
| Immigrants | Japan | 99.5 /100 | #33 | Exceptional 7.4% |
| Russians | 99.5 /100 | #34 | Exceptional 7.5% |
| Greeks | 99.4 /100 | #35 | Exceptional 7.5% |
| Turks | 99.4 /100 | #36 | Exceptional 7.5% |
| Estonians | 99.4 /100 | #37 | Exceptional 7.5% |
| Bolivians | 99.3 /100 | #38 | Exceptional 7.5% |
| Carpatho Rusyns | 99.3 /100 | #39 | Exceptional 7.5% |
| Slovenes | 99.3 /100 | #40 | Exceptional 7.5% |
| Immigrants | Australia | 99.2 /100 | #41 | Exceptional 7.6% |
| Scandinavians | 99.1 /100 | #42 | Exceptional 7.6% |
| Immigrants | Austria | 99.1 /100 | #43 | Exceptional 7.6% |
| Germans | 99.0 /100 | #44 | Exceptional 7.7% |
| Okinawans | 98.9 /100 | #45 | Exceptional 7.7% |