Spanish American vs Arab Family Poverty
COMPARE
Spanish American
Arab
Family Poverty
Family Poverty Comparison
Spanish Americans
Arabs
11.2%
FAMILY POVERTY
0.1/ 100
METRIC RATING
274th/ 347
METRIC RANK
9.2%
FAMILY POVERTY
31.5/ 100
METRIC RATING
190th/ 347
METRIC RANK
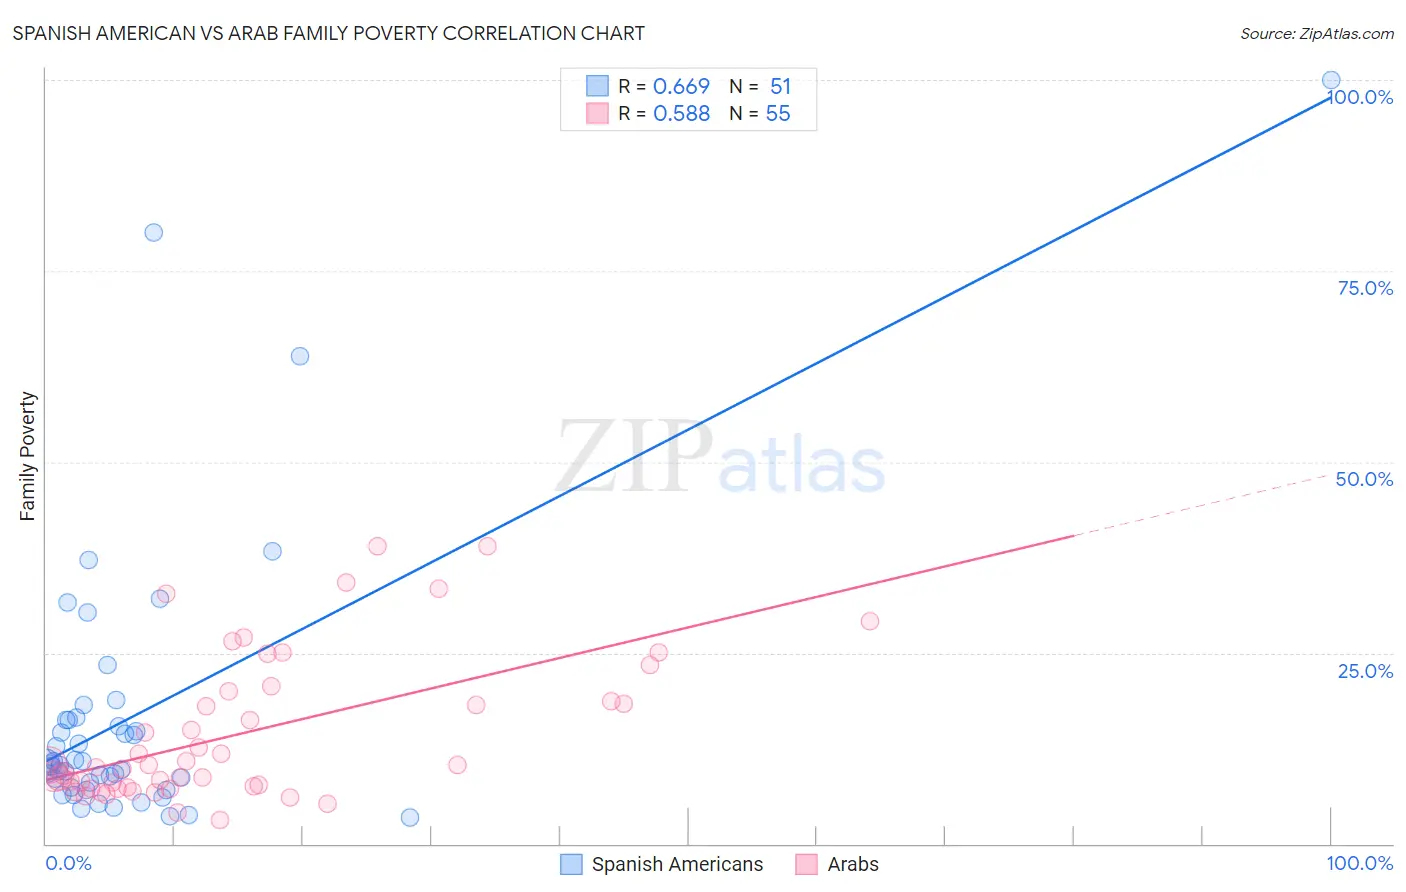
Spanish American vs Arab Family Poverty Correlation Chart
The statistical analysis conducted on geographies consisting of 103,138,189 people shows a significant positive correlation between the proportion of Spanish Americans and poverty level among families in the United States with a correlation coefficient (R) of 0.669 and weighted average of 11.2%. Similarly, the statistical analysis conducted on geographies consisting of 484,664,597 people shows a substantial positive correlation between the proportion of Arabs and poverty level among families in the United States with a correlation coefficient (R) of 0.588 and weighted average of 9.2%, a difference of 21.5%.
Family Poverty Correlation Summary
| Measurement | Spanish American | Arab |
| Minimum | 3.4% | 3.1% |
| Maximum | 100.0% | 39.0% |
| Range | 96.6% | 35.9% |
| Mean | 16.8% | 14.5% |
| Median | 10.5% | 10.2% |
| Interquartile 25% (IQ1) | 7.4% | 7.3% |
| Interquartile 75% (IQ3) | 16.2% | 19.9% |
| Interquartile Range (IQR) | 8.8% | 12.6% |
| Standard Deviation (Sample) | 18.6% | 9.5% |
| Standard Deviation (Population) | 18.4% | 9.4% |
Similar Demographics by Family Poverty
Demographics Similar to Spanish Americans by Family Poverty
In terms of family poverty, the demographic groups most similar to Spanish Americans are Central American (11.2%, a difference of 0.050%), Immigrants from Guyana (11.2%, a difference of 0.070%), Somali (11.2%, a difference of 0.090%), Chippewa (11.2%, a difference of 0.16%), and Guyanese (11.2%, a difference of 0.19%).
| Demographics | Rating | Rank | Family Poverty |
| Comanche | 0.1 /100 | #267 | Tragic 11.0% |
| Jamaicans | 0.1 /100 | #268 | Tragic 11.1% |
| Immigrants | Ecuador | 0.1 /100 | #269 | Tragic 11.1% |
| Immigrants | Nicaragua | 0.1 /100 | #270 | Tragic 11.1% |
| Immigrants | Bahamas | 0.1 /100 | #271 | Tragic 11.1% |
| Immigrants | Jamaica | 0.1 /100 | #272 | Tragic 11.2% |
| Somalis | 0.1 /100 | #273 | Tragic 11.2% |
| Spanish Americans | 0.1 /100 | #274 | Tragic 11.2% |
| Central Americans | 0.1 /100 | #275 | Tragic 11.2% |
| Immigrants | Guyana | 0.1 /100 | #276 | Tragic 11.2% |
| Chippewa | 0.1 /100 | #277 | Tragic 11.2% |
| Guyanese | 0.1 /100 | #278 | Tragic 11.2% |
| Blackfeet | 0.0 /100 | #279 | Tragic 11.3% |
| Belizeans | 0.0 /100 | #280 | Tragic 11.3% |
| Immigrants | West Indies | 0.0 /100 | #281 | Tragic 11.3% |
Demographics Similar to Arabs by Family Poverty
In terms of family poverty, the demographic groups most similar to Arabs are Immigrants from Afghanistan (9.2%, a difference of 0.090%), Immigrants from Kenya (9.2%, a difference of 0.37%), Ugandan (9.3%, a difference of 0.41%), Spanish (9.3%, a difference of 0.42%), and Immigrants from Western Asia (9.3%, a difference of 0.50%).
| Demographics | Rating | Rank | Family Poverty |
| Uruguayans | 39.2 /100 | #183 | Fair 9.1% |
| South American Indians | 38.7 /100 | #184 | Fair 9.1% |
| Immigrants | Saudi Arabia | 38.6 /100 | #185 | Fair 9.1% |
| Colombians | 36.1 /100 | #186 | Fair 9.2% |
| Delaware | 35.4 /100 | #187 | Fair 9.2% |
| Immigrants | Kenya | 34.0 /100 | #188 | Fair 9.2% |
| Immigrants | Afghanistan | 32.1 /100 | #189 | Fair 9.2% |
| Arabs | 31.5 /100 | #190 | Fair 9.2% |
| Ugandans | 28.7 /100 | #191 | Fair 9.3% |
| Spanish | 28.7 /100 | #192 | Fair 9.3% |
| Immigrants | Western Asia | 28.2 /100 | #193 | Fair 9.3% |
| South Americans | 28.1 /100 | #194 | Fair 9.3% |
| Venezuelans | 27.4 /100 | #195 | Fair 9.3% |
| Immigrants | Venezuela | 26.1 /100 | #196 | Fair 9.3% |
| Immigrants | Colombia | 24.4 /100 | #197 | Fair 9.3% |