Spaniard vs South American Indian Cognitive Disability
COMPARE
Spaniard
South American Indian
Cognitive Disability
Cognitive Disability Comparison
Spaniards
South American Indians
17.3%
COGNITIVE DISABILITY
40.3/ 100
METRIC RATING
183rd/ 347
METRIC RANK
17.5%
COGNITIVE DISABILITY
13.0/ 100
METRIC RATING
201st/ 347
METRIC RANK
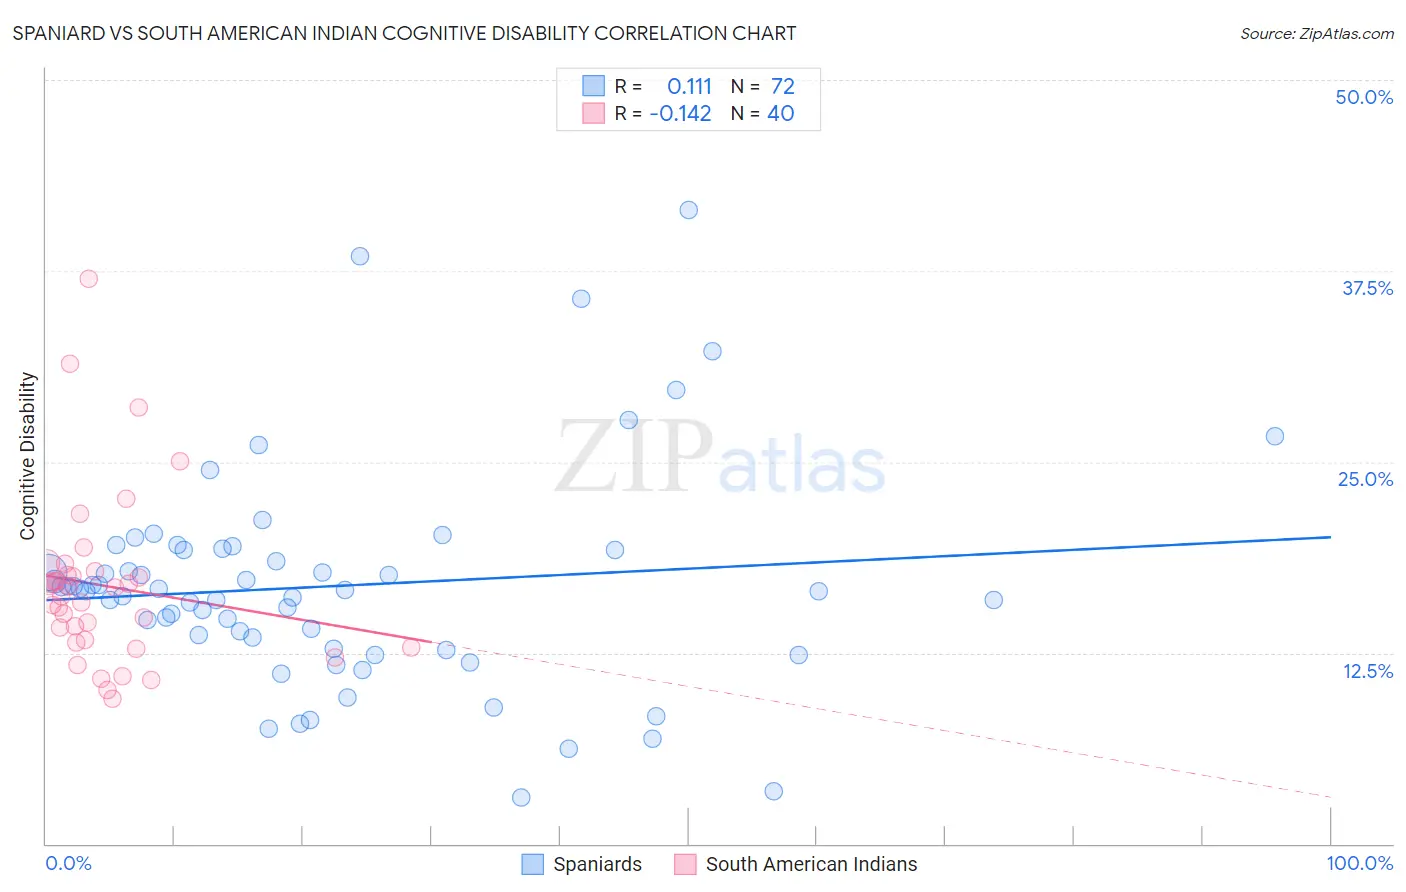
Spaniard vs South American Indian Cognitive Disability Correlation Chart
The statistical analysis conducted on geographies consisting of 443,445,256 people shows a poor positive correlation between the proportion of Spaniards and percentage of population with cognitive disability in the United States with a correlation coefficient (R) of 0.111 and weighted average of 17.3%. Similarly, the statistical analysis conducted on geographies consisting of 164,561,639 people shows a poor negative correlation between the proportion of South American Indians and percentage of population with cognitive disability in the United States with a correlation coefficient (R) of -0.142 and weighted average of 17.5%, a difference of 1.1%.
Cognitive Disability Correlation Summary
| Measurement | Spaniard | South American Indian |
| Minimum | 3.0% | 9.5% |
| Maximum | 41.5% | 37.0% |
| Range | 38.5% | 27.5% |
| Mean | 16.9% | 16.9% |
| Median | 16.6% | 16.5% |
| Interquartile 25% (IQ1) | 13.1% | 13.3% |
| Interquartile 75% (IQ3) | 19.2% | 17.7% |
| Interquartile Range (IQR) | 6.1% | 4.5% |
| Standard Deviation (Sample) | 7.1% | 5.6% |
| Standard Deviation (Population) | 7.0% | 5.6% |
Demographics Similar to Spaniards and South American Indians by Cognitive Disability
In terms of cognitive disability, the demographic groups most similar to Spaniards are Crow (17.3%, a difference of 0.040%), Afghan (17.3%, a difference of 0.060%), Arab (17.3%, a difference of 0.070%), Cambodian (17.3%, a difference of 0.13%), and Immigrants from Fiji (17.4%, a difference of 0.20%). Similarly, the demographic groups most similar to South American Indians are Immigrants from Morocco (17.5%, a difference of 0.060%), Haitian (17.5%, a difference of 0.070%), Immigrants from Singapore (17.5%, a difference of 0.080%), Immigrants from Panama (17.5%, a difference of 0.11%), and Immigrants from Afghanistan (17.5%, a difference of 0.21%).
| Demographics | Rating | Rank | Cognitive Disability |
| Arabs | 42.8 /100 | #182 | Average 17.3% |
| Spaniards | 40.3 /100 | #183 | Average 17.3% |
| Crow | 39.1 /100 | #184 | Fair 17.3% |
| Afghans | 38.2 /100 | #185 | Fair 17.3% |
| Cambodians | 35.9 /100 | #186 | Fair 17.3% |
| Immigrants | Fiji | 33.7 /100 | #187 | Fair 17.4% |
| Immigrants | France | 29.8 /100 | #188 | Fair 17.4% |
| Immigrants | Western Asia | 29.5 /100 | #189 | Fair 17.4% |
| Immigrants | Spain | 27.7 /100 | #190 | Fair 17.4% |
| Immigrants | Nonimmigrants | 27.4 /100 | #191 | Fair 17.4% |
| Immigrants | Haiti | 27.1 /100 | #192 | Fair 17.4% |
| Delaware | 25.6 /100 | #193 | Fair 17.4% |
| Immigrants | Bosnia and Herzegovina | 22.0 /100 | #194 | Fair 17.4% |
| New Zealanders | 21.1 /100 | #195 | Fair 17.4% |
| Guyanese | 17.5 /100 | #196 | Poor 17.5% |
| Immigrants | Afghanistan | 16.7 /100 | #197 | Poor 17.5% |
| Immigrants | Panama | 14.8 /100 | #198 | Poor 17.5% |
| Immigrants | Singapore | 14.3 /100 | #199 | Poor 17.5% |
| Haitians | 14.1 /100 | #200 | Poor 17.5% |
| South American Indians | 13.0 /100 | #201 | Poor 17.5% |
| Immigrants | Morocco | 12.0 /100 | #202 | Poor 17.5% |