Kiowa vs Immigrants from Haiti Female Poverty
COMPARE
Kiowa
Immigrants from Haiti
Female Poverty
Female Poverty Comparison
Kiowa
Immigrants from Haiti
18.6%
FEMALE POVERTY
0.0/ 100
METRIC RATING
329th/ 347
METRIC RANK
16.1%
FEMALE POVERTY
0.0/ 100
METRIC RATING
282nd/ 347
METRIC RANK
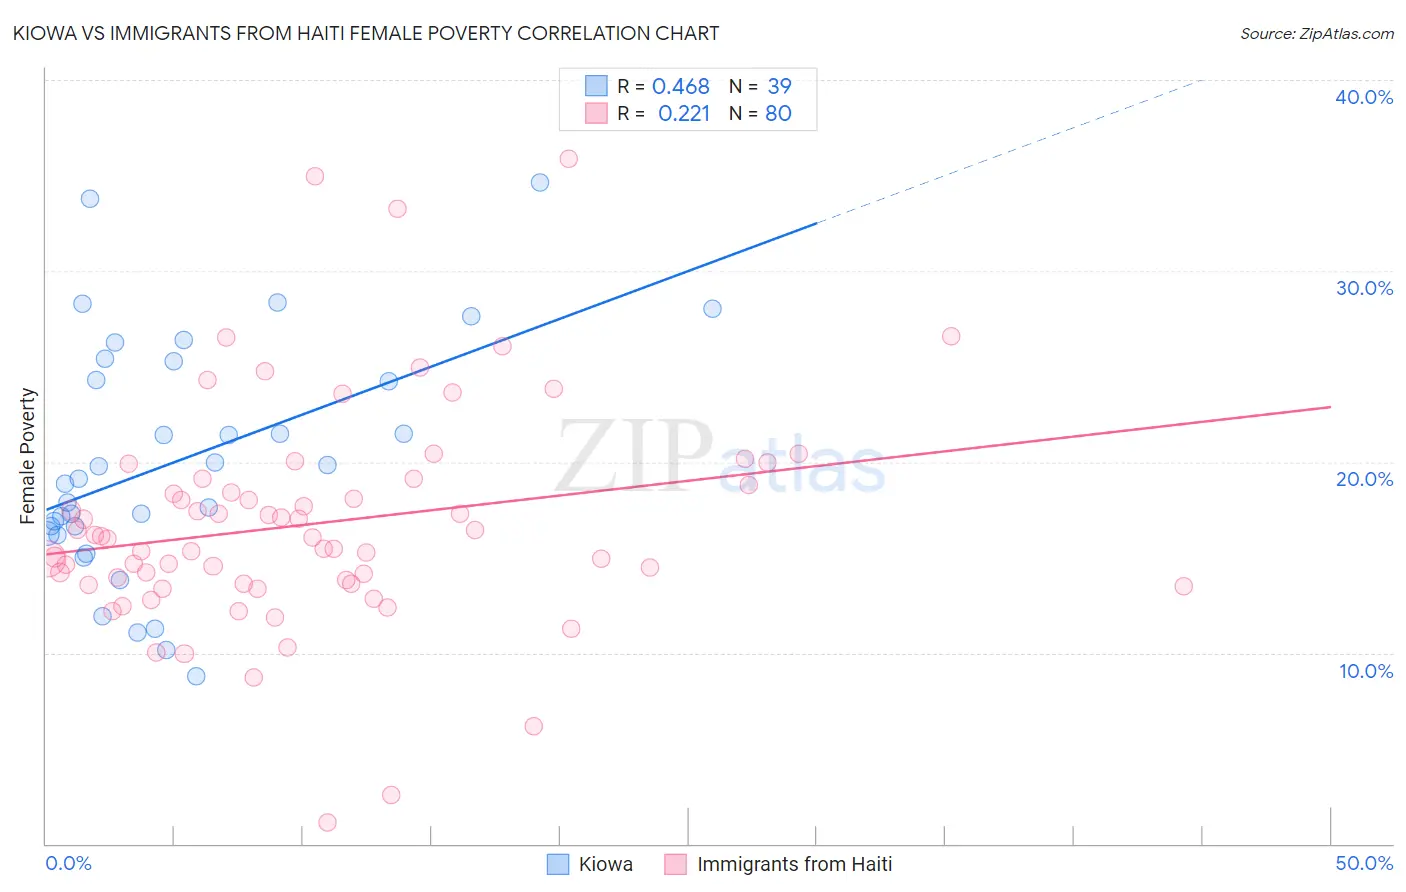
Kiowa vs Immigrants from Haiti Female Poverty Correlation Chart
The statistical analysis conducted on geographies consisting of 56,097,884 people shows a moderate positive correlation between the proportion of Kiowa and poverty level among females in the United States with a correlation coefficient (R) of 0.468 and weighted average of 18.6%. Similarly, the statistical analysis conducted on geographies consisting of 225,156,546 people shows a weak positive correlation between the proportion of Immigrants from Haiti and poverty level among females in the United States with a correlation coefficient (R) of 0.221 and weighted average of 16.1%, a difference of 15.3%.
Female Poverty Correlation Summary
| Measurement | Kiowa | Immigrants from Haiti |
| Minimum | 8.8% | 1.1% |
| Maximum | 34.7% | 35.8% |
| Range | 25.9% | 34.7% |
| Mean | 20.1% | 16.8% |
| Median | 19.1% | 16.0% |
| Interquartile 25% (IQ1) | 16.3% | 13.6% |
| Interquartile 75% (IQ3) | 25.2% | 19.0% |
| Interquartile Range (IQR) | 9.0% | 5.3% |
| Standard Deviation (Sample) | 6.2% | 5.9% |
| Standard Deviation (Population) | 6.1% | 5.9% |
Similar Demographics by Female Poverty
Demographics Similar to Kiowa by Female Poverty
In terms of female poverty, the demographic groups most similar to Kiowa are Black/African American (18.6%, a difference of 0.12%), Dominican (19.1%, a difference of 2.7%), Yakama (18.0%, a difference of 3.1%), Native/Alaskan (19.2%, a difference of 3.2%), and Central American Indian (18.0%, a difference of 3.2%).
| Demographics | Rating | Rank | Female Poverty |
| Menominee | 0.0 /100 | #322 | Tragic 17.6% |
| Paiute | 0.0 /100 | #323 | Tragic 17.7% |
| Immigrants | Honduras | 0.0 /100 | #324 | Tragic 17.7% |
| Colville | 0.0 /100 | #325 | Tragic 17.8% |
| Central American Indians | 0.0 /100 | #326 | Tragic 18.0% |
| Yakama | 0.0 /100 | #327 | Tragic 18.0% |
| Blacks/African Americans | 0.0 /100 | #328 | Tragic 18.6% |
| Kiowa | 0.0 /100 | #329 | Tragic 18.6% |
| Dominicans | 0.0 /100 | #330 | Tragic 19.1% |
| Natives/Alaskans | 0.0 /100 | #331 | Tragic 19.2% |
| Apache | 0.0 /100 | #332 | Tragic 19.2% |
| Immigrants | Dominican Republic | 0.0 /100 | #333 | Tragic 19.3% |
| Houma | 0.0 /100 | #334 | Tragic 20.0% |
| Cheyenne | 0.0 /100 | #335 | Tragic 20.2% |
| Pueblo | 0.0 /100 | #336 | Tragic 20.7% |
Demographics Similar to Immigrants from Haiti by Female Poverty
In terms of female poverty, the demographic groups most similar to Immigrants from Haiti are Immigrants from Cuba (16.1%, a difference of 0.080%), Spanish American (16.2%, a difference of 0.13%), West Indian (16.1%, a difference of 0.15%), Vietnamese (16.1%, a difference of 0.17%), and Comanche (16.2%, a difference of 0.21%).
| Demographics | Rating | Rank | Female Poverty |
| Immigrants | Barbados | 0.0 /100 | #275 | Tragic 16.0% |
| Central Americans | 0.0 /100 | #276 | Tragic 16.0% |
| Bangladeshis | 0.0 /100 | #277 | Tragic 16.0% |
| Immigrants | West Indies | 0.0 /100 | #278 | Tragic 16.1% |
| Immigrants | Bahamas | 0.0 /100 | #279 | Tragic 16.1% |
| Vietnamese | 0.0 /100 | #280 | Tragic 16.1% |
| West Indians | 0.0 /100 | #281 | Tragic 16.1% |
| Immigrants | Haiti | 0.0 /100 | #282 | Tragic 16.1% |
| Immigrants | Cuba | 0.0 /100 | #283 | Tragic 16.1% |
| Spanish Americans | 0.0 /100 | #284 | Tragic 16.2% |
| Comanche | 0.0 /100 | #285 | Tragic 16.2% |
| Inupiat | 0.0 /100 | #286 | Tragic 16.2% |
| Immigrants | Belize | 0.0 /100 | #287 | Tragic 16.3% |
| Indonesians | 0.0 /100 | #288 | Tragic 16.4% |
| Blackfeet | 0.0 /100 | #289 | Tragic 16.4% |