Spaniard vs Immigrants from Congo 8th Grade
COMPARE
Spaniard
Immigrants from Congo
8th Grade
8th Grade Comparison
Spaniards
Immigrants from Congo
95.8%
8TH GRADE
60.0/ 100
METRIC RATING
167th/ 347
METRIC RANK
94.9%
8TH GRADE
0.6/ 100
METRIC RATING
258th/ 347
METRIC RANK
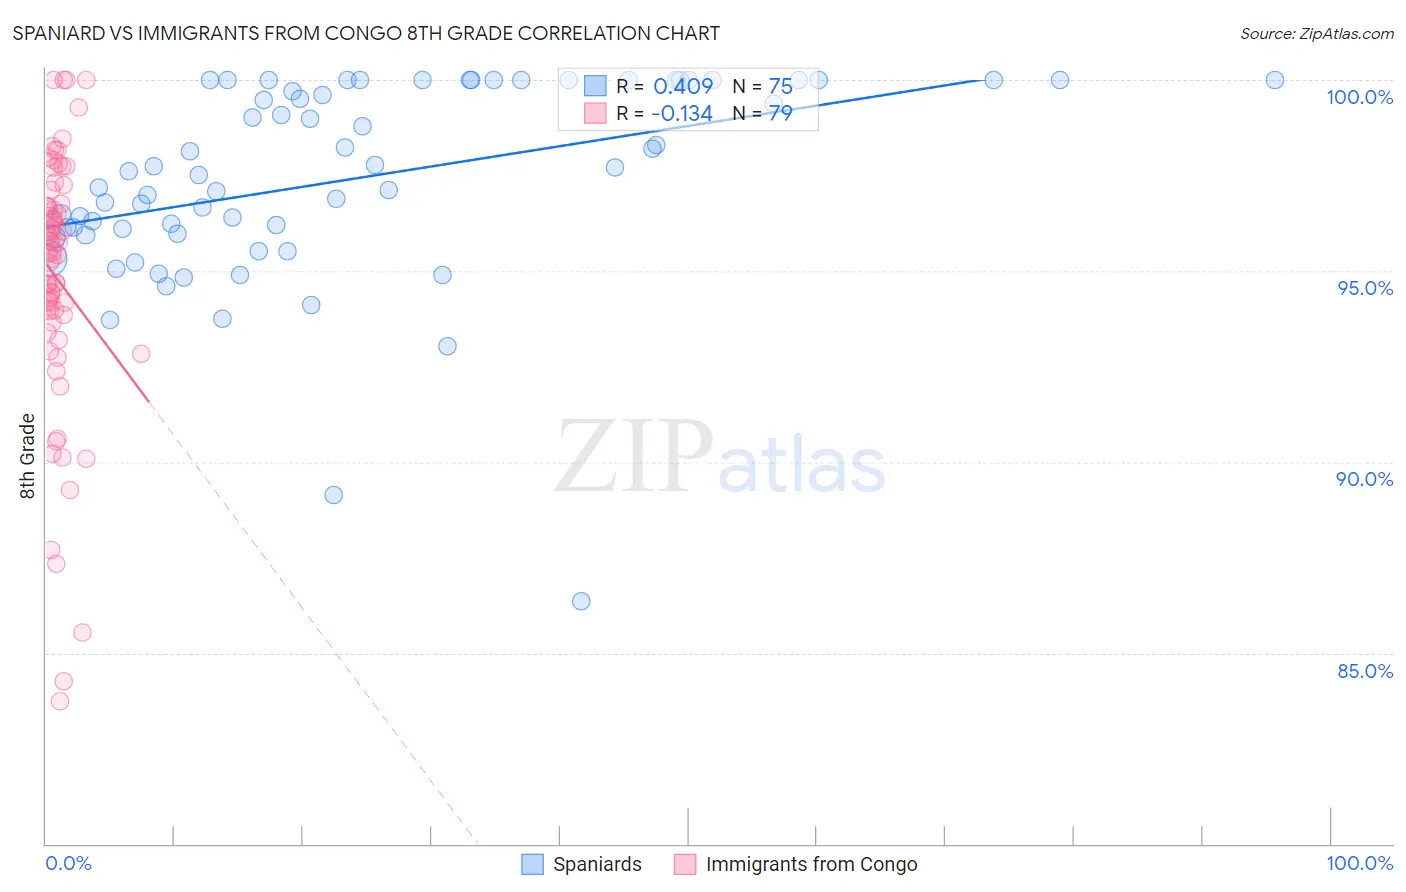
Spaniard vs Immigrants from Congo 8th Grade Correlation Chart
The statistical analysis conducted on geographies consisting of 443,544,503 people shows a moderate positive correlation between the proportion of Spaniards and percentage of population with at least 8th grade education in the United States with a correlation coefficient (R) of 0.409 and weighted average of 95.8%. Similarly, the statistical analysis conducted on geographies consisting of 92,121,907 people shows a poor negative correlation between the proportion of Immigrants from Congo and percentage of population with at least 8th grade education in the United States with a correlation coefficient (R) of -0.134 and weighted average of 94.9%, a difference of 0.90%.
8th Grade Correlation Summary
| Measurement | Spaniard | Immigrants from Congo |
| Minimum | 86.4% | 83.7% |
| Maximum | 100.0% | 100.0% |
| Range | 13.6% | 16.3% |
| Mean | 97.4% | 94.8% |
| Median | 97.6% | 95.5% |
| Interquartile 25% (IQ1) | 96.0% | 93.8% |
| Interquartile 75% (IQ3) | 100.0% | 96.7% |
| Interquartile Range (IQR) | 4.0% | 2.9% |
| Standard Deviation (Sample) | 2.6% | 3.4% |
| Standard Deviation (Population) | 2.6% | 3.4% |
Similar Demographics by 8th Grade
Demographics Similar to Spaniards by 8th Grade
In terms of 8th grade, the demographic groups most similar to Spaniards are Immigrants from Ukraine (95.8%, a difference of 0.0%), Alsatian (95.8%, a difference of 0.010%), Immigrants from Poland (95.8%, a difference of 0.010%), Immigrants from Iran (95.8%, a difference of 0.010%), and Ute (95.8%, a difference of 0.010%).
| Demographics | Rating | Rank | 8th Grade |
| Seminole | 67.7 /100 | #160 | Good 95.8% |
| Bermudans | 67.5 /100 | #161 | Good 95.8% |
| Immigrants | Kenya | 67.2 /100 | #162 | Good 95.8% |
| Immigrants | Sri Lanka | 64.1 /100 | #163 | Good 95.8% |
| Immigrants | Italy | 63.5 /100 | #164 | Good 95.8% |
| Alsatians | 61.4 /100 | #165 | Good 95.8% |
| Immigrants | Poland | 61.1 /100 | #166 | Good 95.8% |
| Spaniards | 60.0 /100 | #167 | Good 95.8% |
| Immigrants | Ukraine | 59.5 /100 | #168 | Average 95.8% |
| Immigrants | Iran | 58.6 /100 | #169 | Average 95.8% |
| Ute | 58.5 /100 | #170 | Average 95.8% |
| Egyptians | 58.2 /100 | #171 | Average 95.8% |
| Immigrants | Korea | 57.9 /100 | #172 | Average 95.8% |
| Mongolians | 53.0 /100 | #173 | Average 95.8% |
| Chileans | 50.0 /100 | #174 | Average 95.7% |
Demographics Similar to Immigrants from Congo by 8th Grade
In terms of 8th grade, the demographic groups most similar to Immigrants from Congo are Ghanaian (94.9%, a difference of 0.0%), Afghan (94.9%, a difference of 0.010%), Immigrants from Jamaica (94.9%, a difference of 0.010%), Colombian (95.0%, a difference of 0.020%), and Immigrants from Somalia (95.0%, a difference of 0.030%).
| Demographics | Rating | Rank | 8th Grade |
| Bolivians | 1.0 /100 | #251 | Tragic 95.0% |
| Immigrants | Ethiopia | 1.0 /100 | #252 | Tragic 95.0% |
| U.S. Virgin Islanders | 0.9 /100 | #253 | Tragic 95.0% |
| Immigrants | Cameroon | 0.8 /100 | #254 | Tragic 95.0% |
| Immigrants | Somalia | 0.7 /100 | #255 | Tragic 95.0% |
| Colombians | 0.7 /100 | #256 | Tragic 95.0% |
| Afghans | 0.6 /100 | #257 | Tragic 94.9% |
| Immigrants | Congo | 0.6 /100 | #258 | Tragic 94.9% |
| Ghanaians | 0.6 /100 | #259 | Tragic 94.9% |
| Immigrants | Jamaica | 0.6 /100 | #260 | Tragic 94.9% |
| Immigrants | Costa Rica | 0.5 /100 | #261 | Tragic 94.9% |
| Immigrants | Nigeria | 0.4 /100 | #262 | Tragic 94.9% |
| Immigrants | Hong Kong | 0.4 /100 | #263 | Tragic 94.9% |
| South Americans | 0.4 /100 | #264 | Tragic 94.9% |
| Yuman | 0.4 /100 | #265 | Tragic 94.9% |