Spaniard vs Immigrants from Chile Child Poverty Under the Age of 5
COMPARE
Spaniard
Immigrants from Chile
Child Poverty Under the Age of 5
Child Poverty Under the Age of 5 Comparison
Spaniards
Immigrants from Chile
18.1%
CHILD POVERTY UNDER THE AGE OF 5
12.8/ 100
METRIC RATING
205th/ 347
METRIC RANK
16.4%
CHILD POVERTY UNDER THE AGE OF 5
85.3/ 100
METRIC RATING
137th/ 347
METRIC RANK
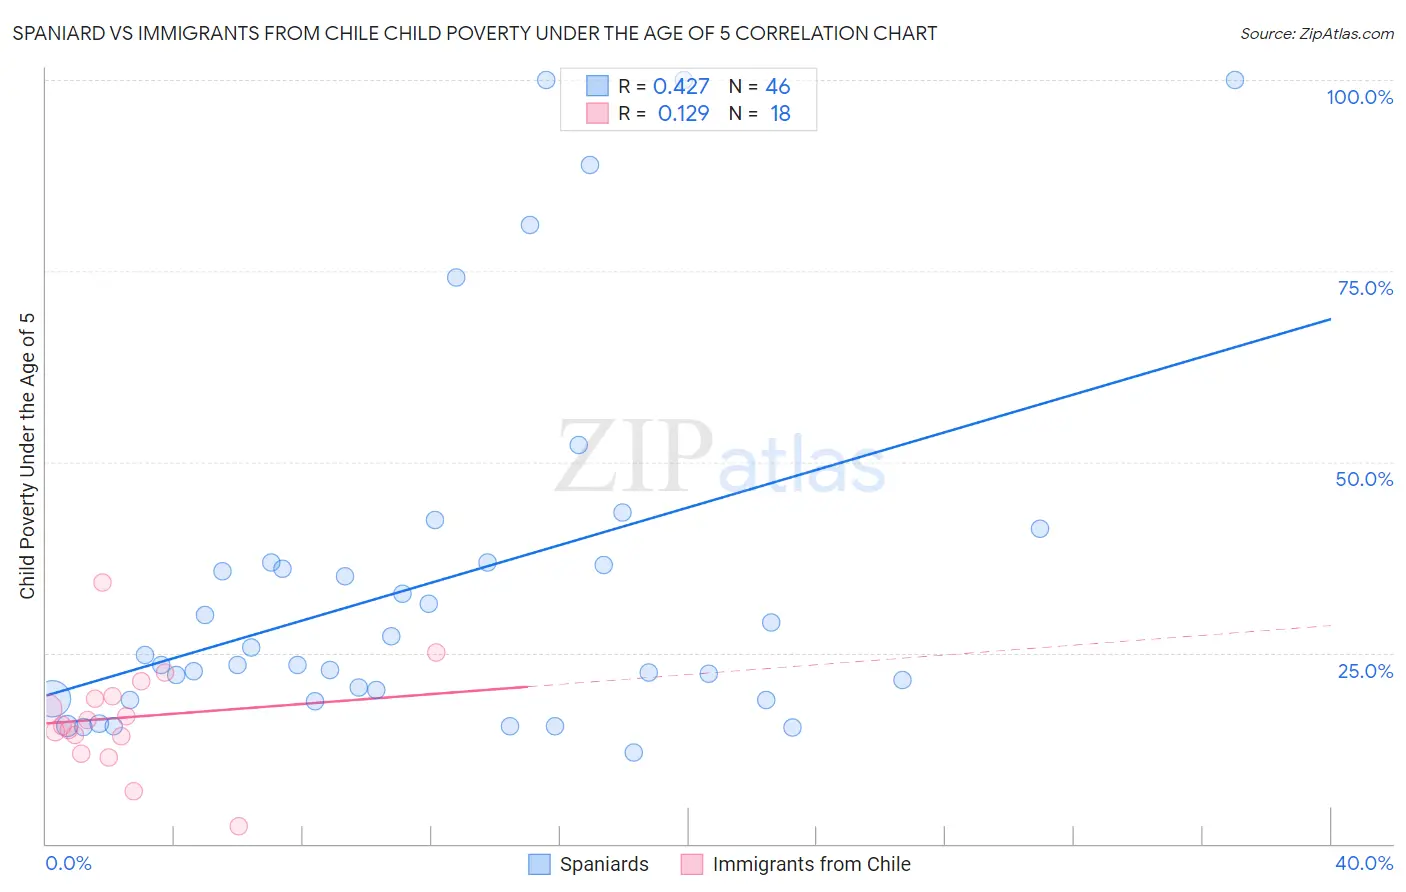
Spaniard vs Immigrants from Chile Child Poverty Under the Age of 5 Correlation Chart
The statistical analysis conducted on geographies consisting of 424,376,046 people shows a moderate positive correlation between the proportion of Spaniards and poverty level among children under the age of 5 in the United States with a correlation coefficient (R) of 0.427 and weighted average of 18.1%. Similarly, the statistical analysis conducted on geographies consisting of 213,144,685 people shows a poor positive correlation between the proportion of Immigrants from Chile and poverty level among children under the age of 5 in the United States with a correlation coefficient (R) of 0.129 and weighted average of 16.4%, a difference of 10.0%.
Child Poverty Under the Age of 5 Correlation Summary
| Measurement | Spaniard | Immigrants from Chile |
| Minimum | 11.9% | 2.3% |
| Maximum | 100.0% | 34.3% |
| Range | 88.1% | 32.0% |
| Mean | 34.4% | 16.5% |
| Median | 24.1% | 15.9% |
| Interquartile 25% (IQ1) | 19.0% | 14.0% |
| Interquartile 75% (IQ3) | 36.8% | 19.4% |
| Interquartile Range (IQR) | 17.7% | 5.3% |
| Standard Deviation (Sample) | 24.1% | 7.0% |
| Standard Deviation (Population) | 23.8% | 6.8% |
Similar Demographics by Child Poverty Under the Age of 5
Demographics Similar to Spaniards by Child Poverty Under the Age of 5
In terms of child poverty under the age of 5, the demographic groups most similar to Spaniards are White/Caucasian (18.1%, a difference of 0.060%), Immigrants from Eastern Africa (18.1%, a difference of 0.13%), Immigrants from Cambodia (18.1%, a difference of 0.19%), Japanese (18.1%, a difference of 0.21%), and Ugandan (18.0%, a difference of 0.22%).
| Demographics | Rating | Rank | Child Poverty Under the Age of 5 |
| Celtics | 18.3 /100 | #198 | Poor 17.9% |
| Hungarians | 18.3 /100 | #199 | Poor 17.9% |
| Iraqis | 14.0 /100 | #200 | Poor 18.0% |
| Ugandans | 13.9 /100 | #201 | Poor 18.0% |
| Japanese | 13.8 /100 | #202 | Poor 18.1% |
| Immigrants | Cambodia | 13.7 /100 | #203 | Poor 18.1% |
| Immigrants | Eastern Africa | 13.4 /100 | #204 | Poor 18.1% |
| Spaniards | 12.8 /100 | #205 | Poor 18.1% |
| Whites/Caucasians | 12.6 /100 | #206 | Poor 18.1% |
| Immigrants | Immigrants | 9.9 /100 | #207 | Tragic 18.2% |
| Scotch-Irish | 9.8 /100 | #208 | Tragic 18.2% |
| Spanish | 9.8 /100 | #209 | Tragic 18.2% |
| Panamanians | 9.7 /100 | #210 | Tragic 18.2% |
| Moroccans | 9.4 /100 | #211 | Tragic 18.2% |
| Nepalese | 8.7 /100 | #212 | Tragic 18.3% |
Demographics Similar to Immigrants from Chile by Child Poverty Under the Age of 5
In terms of child poverty under the age of 5, the demographic groups most similar to Immigrants from Chile are German (16.5%, a difference of 0.10%), Immigrants from Hungary (16.5%, a difference of 0.16%), Guamanian/Chamorro (16.5%, a difference of 0.23%), Immigrants from Western Europe (16.5%, a difference of 0.42%), and Portuguese (16.5%, a difference of 0.46%).
| Demographics | Rating | Rank | Child Poverty Under the Age of 5 |
| Immigrants | Norway | 89.3 /100 | #130 | Excellent 16.3% |
| Finns | 88.3 /100 | #131 | Excellent 16.3% |
| Serbians | 88.2 /100 | #132 | Excellent 16.3% |
| Icelanders | 87.9 /100 | #133 | Excellent 16.3% |
| Immigrants | North Macedonia | 87.8 /100 | #134 | Excellent 16.4% |
| Brazilians | 87.8 /100 | #135 | Excellent 16.4% |
| Immigrants | Northern Africa | 87.5 /100 | #136 | Excellent 16.4% |
| Immigrants | Chile | 85.3 /100 | #137 | Excellent 16.4% |
| Germans | 84.8 /100 | #138 | Excellent 16.5% |
| Immigrants | Hungary | 84.5 /100 | #139 | Excellent 16.5% |
| Guamanians/Chamorros | 84.2 /100 | #140 | Excellent 16.5% |
| Immigrants | Western Europe | 83.3 /100 | #141 | Excellent 16.5% |
| Portuguese | 83.0 /100 | #142 | Excellent 16.5% |
| Samoans | 83.0 /100 | #143 | Excellent 16.5% |
| Ethiopians | 82.7 /100 | #144 | Excellent 16.5% |