Basque vs Immigrants from Chile Child Poverty Under the Age of 5
COMPARE
Basque
Immigrants from Chile
Child Poverty Under the Age of 5
Child Poverty Under the Age of 5 Comparison
Basques
Immigrants from Chile
16.0%
CHILD POVERTY UNDER THE AGE OF 5
93.4/ 100
METRIC RATING
117th/ 347
METRIC RANK
16.4%
CHILD POVERTY UNDER THE AGE OF 5
85.3/ 100
METRIC RATING
137th/ 347
METRIC RANK
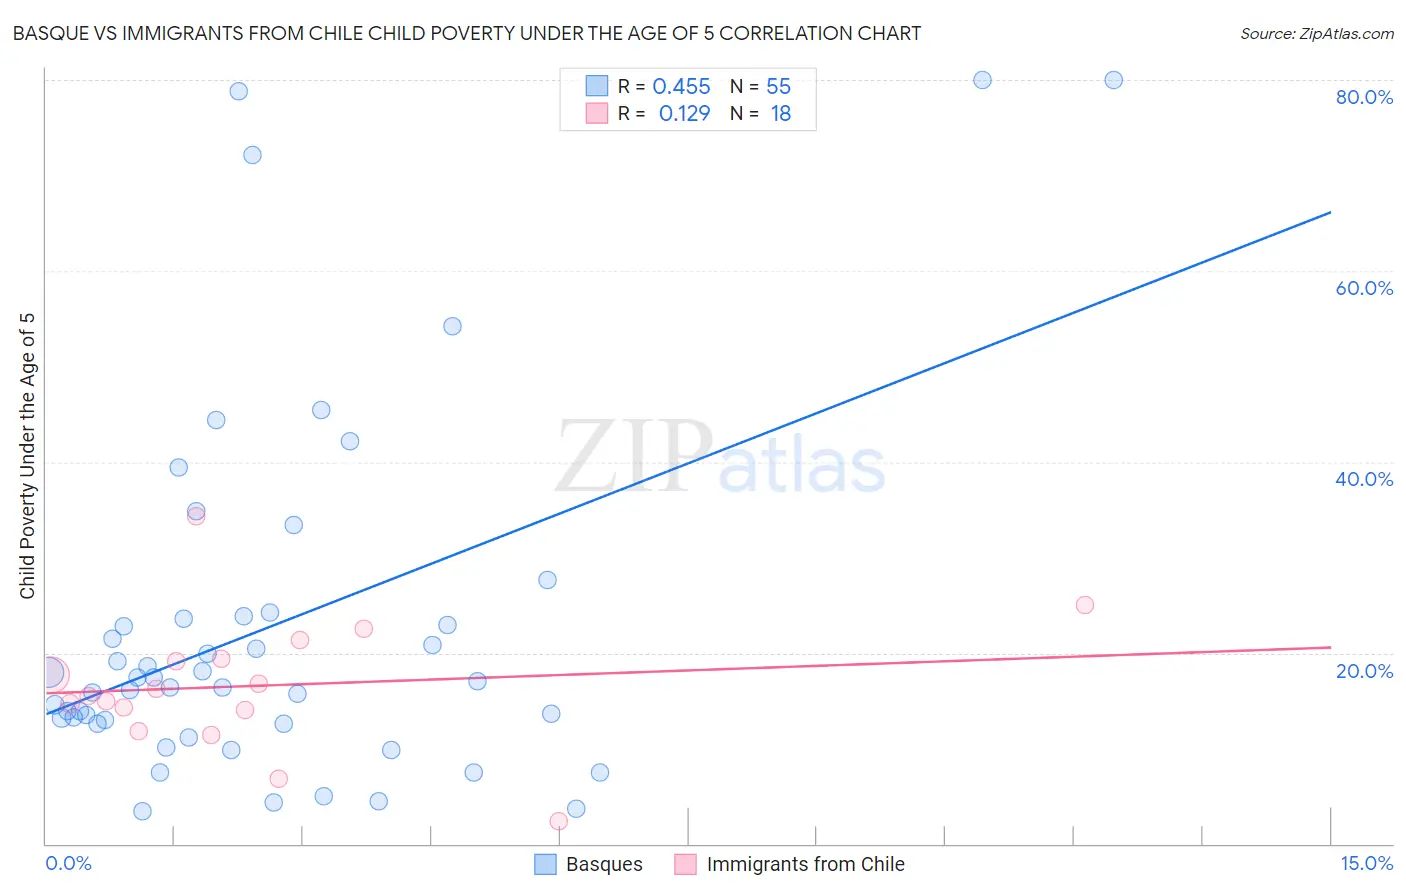
Basque vs Immigrants from Chile Child Poverty Under the Age of 5 Correlation Chart
The statistical analysis conducted on geographies consisting of 162,359,571 people shows a moderate positive correlation between the proportion of Basques and poverty level among children under the age of 5 in the United States with a correlation coefficient (R) of 0.455 and weighted average of 16.0%. Similarly, the statistical analysis conducted on geographies consisting of 213,144,685 people shows a poor positive correlation between the proportion of Immigrants from Chile and poverty level among children under the age of 5 in the United States with a correlation coefficient (R) of 0.129 and weighted average of 16.4%, a difference of 2.5%.
Child Poverty Under the Age of 5 Correlation Summary
| Measurement | Basque | Immigrants from Chile |
| Minimum | 3.4% | 2.3% |
| Maximum | 80.0% | 34.3% |
| Range | 76.6% | 32.0% |
| Mean | 22.8% | 16.5% |
| Median | 17.1% | 15.9% |
| Interquartile 25% (IQ1) | 12.6% | 14.0% |
| Interquartile 75% (IQ3) | 23.8% | 19.4% |
| Interquartile Range (IQR) | 11.2% | 5.3% |
| Standard Deviation (Sample) | 19.0% | 7.0% |
| Standard Deviation (Population) | 18.8% | 6.8% |
Demographics Similar to Basques and Immigrants from Chile by Child Poverty Under the Age of 5
In terms of child poverty under the age of 5, the demographic groups most similar to Basques are Immigrants from Denmark (16.0%, a difference of 0.0%), Immigrants from Jordan (16.1%, a difference of 0.11%), Immigrants from Peru (16.1%, a difference of 0.38%), Mongolian (16.1%, a difference of 0.38%), and Immigrants from Southern Europe (16.1%, a difference of 0.58%). Similarly, the demographic groups most similar to Immigrants from Chile are Immigrants from Northern Africa (16.4%, a difference of 0.52%), Brazilian (16.4%, a difference of 0.58%), Immigrants from North Macedonia (16.4%, a difference of 0.59%), Icelander (16.3%, a difference of 0.61%), and Serbian (16.3%, a difference of 0.68%).
| Demographics | Rating | Rank | Child Poverty Under the Age of 5 |
| Basques | 93.4 /100 | #117 | Exceptional 16.0% |
| Immigrants | Denmark | 93.4 /100 | #118 | Exceptional 16.0% |
| Immigrants | Jordan | 93.2 /100 | #119 | Exceptional 16.1% |
| Immigrants | Peru | 92.6 /100 | #120 | Exceptional 16.1% |
| Mongolians | 92.5 /100 | #121 | Exceptional 16.1% |
| Immigrants | Southern Europe | 92.0 /100 | #122 | Exceptional 16.1% |
| Austrians | 92.0 /100 | #123 | Exceptional 16.1% |
| Swiss | 92.0 /100 | #124 | Exceptional 16.1% |
| Native Hawaiians | 91.8 /100 | #125 | Exceptional 16.2% |
| Immigrants | Albania | 91.8 /100 | #126 | Exceptional 16.2% |
| Immigrants | England | 91.5 /100 | #127 | Exceptional 16.2% |
| South Africans | 90.1 /100 | #128 | Exceptional 16.2% |
| British | 89.4 /100 | #129 | Excellent 16.3% |
| Immigrants | Norway | 89.3 /100 | #130 | Excellent 16.3% |
| Finns | 88.3 /100 | #131 | Excellent 16.3% |
| Serbians | 88.2 /100 | #132 | Excellent 16.3% |
| Icelanders | 87.9 /100 | #133 | Excellent 16.3% |
| Immigrants | North Macedonia | 87.8 /100 | #134 | Excellent 16.4% |
| Brazilians | 87.8 /100 | #135 | Excellent 16.4% |
| Immigrants | Northern Africa | 87.5 /100 | #136 | Excellent 16.4% |
| Immigrants | Chile | 85.3 /100 | #137 | Excellent 16.4% |