Irish vs Immigrants from Chile Child Poverty Under the Age of 5
COMPARE
Irish
Immigrants from Chile
Child Poverty Under the Age of 5
Child Poverty Under the Age of 5 Comparison
Irish
Immigrants from Chile
16.8%
CHILD POVERTY UNDER THE AGE OF 5
72.0/ 100
METRIC RATING
160th/ 347
METRIC RANK
16.4%
CHILD POVERTY UNDER THE AGE OF 5
85.3/ 100
METRIC RATING
137th/ 347
METRIC RANK
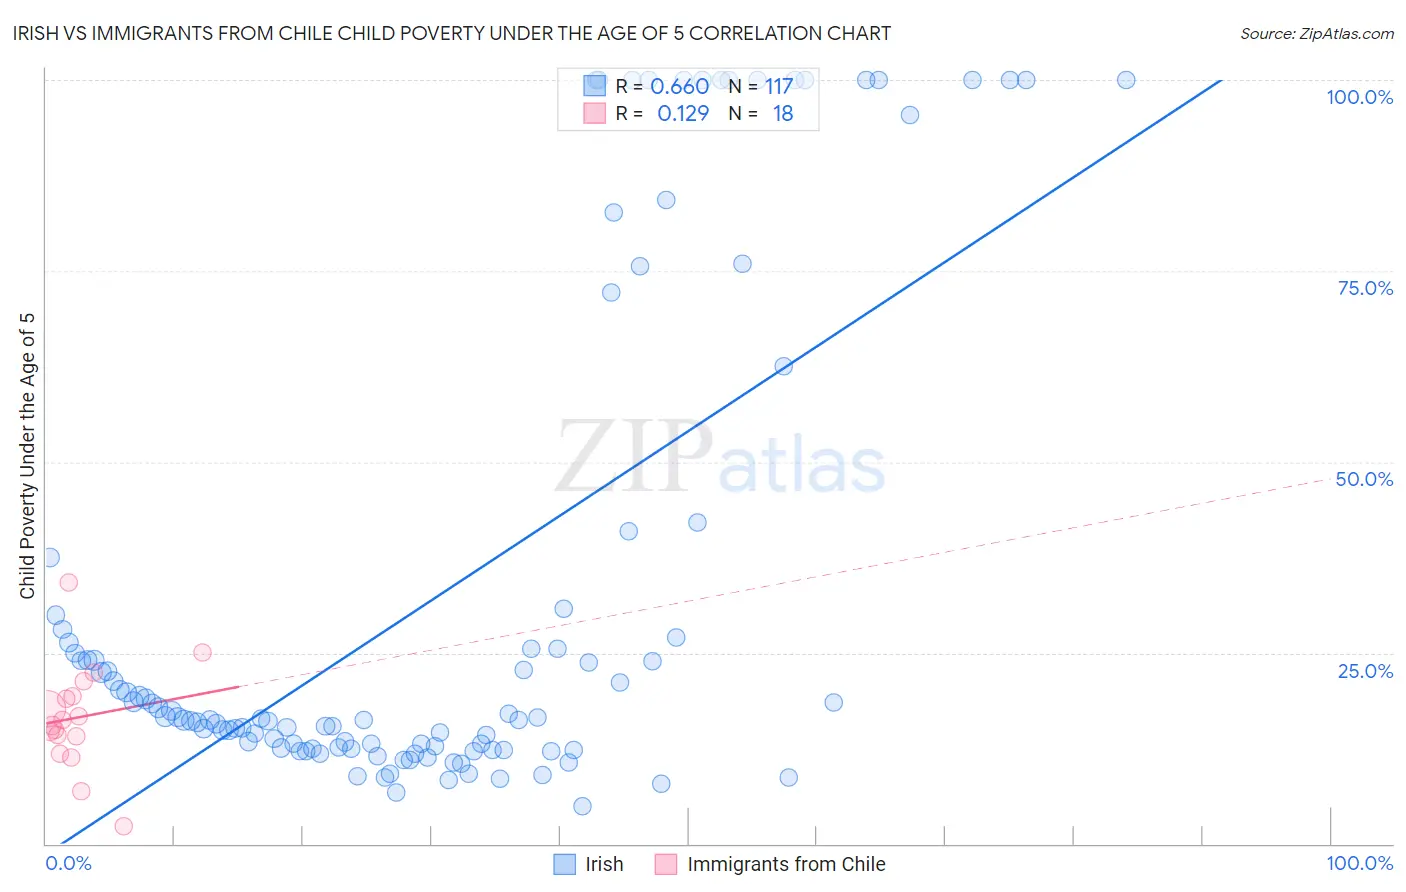
Irish vs Immigrants from Chile Child Poverty Under the Age of 5 Correlation Chart
The statistical analysis conducted on geographies consisting of 536,582,849 people shows a significant positive correlation between the proportion of Irish and poverty level among children under the age of 5 in the United States with a correlation coefficient (R) of 0.660 and weighted average of 16.8%. Similarly, the statistical analysis conducted on geographies consisting of 213,144,685 people shows a poor positive correlation between the proportion of Immigrants from Chile and poverty level among children under the age of 5 in the United States with a correlation coefficient (R) of 0.129 and weighted average of 16.4%, a difference of 2.2%.
Child Poverty Under the Age of 5 Correlation Summary
| Measurement | Irish | Immigrants from Chile |
| Minimum | 4.9% | 2.3% |
| Maximum | 100.0% | 34.3% |
| Range | 95.1% | 32.0% |
| Mean | 32.4% | 16.5% |
| Median | 16.4% | 15.9% |
| Interquartile 25% (IQ1) | 12.5% | 14.0% |
| Interquartile 75% (IQ3) | 29.0% | 19.4% |
| Interquartile Range (IQR) | 16.5% | 5.3% |
| Standard Deviation (Sample) | 32.3% | 7.0% |
| Standard Deviation (Population) | 32.1% | 6.8% |
Similar Demographics by Child Poverty Under the Age of 5
Demographics Similar to Irish by Child Poverty Under the Age of 5
In terms of child poverty under the age of 5, the demographic groups most similar to Irish are Immigrants from Syria (16.8%, a difference of 0.030%), Czechoslovakian (16.8%, a difference of 0.060%), English (16.8%, a difference of 0.22%), Venezuelan (16.8%, a difference of 0.23%), and Costa Rican (16.9%, a difference of 0.28%).
| Demographics | Rating | Rank | Child Poverty Under the Age of 5 |
| Dutch | 77.1 /100 | #153 | Good 16.7% |
| Immigrants | Venezuela | 76.0 /100 | #154 | Good 16.7% |
| South Americans | 75.1 /100 | #155 | Good 16.7% |
| Afghans | 74.4 /100 | #156 | Good 16.8% |
| Venezuelans | 73.7 /100 | #157 | Good 16.8% |
| Czechoslovakians | 72.5 /100 | #158 | Good 16.8% |
| Immigrants | Syria | 72.3 /100 | #159 | Good 16.8% |
| Irish | 72.0 /100 | #160 | Good 16.8% |
| English | 70.4 /100 | #161 | Good 16.8% |
| Costa Ricans | 69.8 /100 | #162 | Good 16.9% |
| Scottish | 68.6 /100 | #163 | Good 16.9% |
| Immigrants | Oceania | 67.6 /100 | #164 | Good 16.9% |
| Immigrants | Colombia | 66.9 /100 | #165 | Good 16.9% |
| Slavs | 64.0 /100 | #166 | Good 17.0% |
| Immigrants | Uzbekistan | 62.0 /100 | #167 | Good 17.0% |
Demographics Similar to Immigrants from Chile by Child Poverty Under the Age of 5
In terms of child poverty under the age of 5, the demographic groups most similar to Immigrants from Chile are German (16.5%, a difference of 0.10%), Immigrants from Hungary (16.5%, a difference of 0.16%), Guamanian/Chamorro (16.5%, a difference of 0.23%), Immigrants from Western Europe (16.5%, a difference of 0.42%), and Portuguese (16.5%, a difference of 0.46%).
| Demographics | Rating | Rank | Child Poverty Under the Age of 5 |
| Immigrants | Norway | 89.3 /100 | #130 | Excellent 16.3% |
| Finns | 88.3 /100 | #131 | Excellent 16.3% |
| Serbians | 88.2 /100 | #132 | Excellent 16.3% |
| Icelanders | 87.9 /100 | #133 | Excellent 16.3% |
| Immigrants | North Macedonia | 87.8 /100 | #134 | Excellent 16.4% |
| Brazilians | 87.8 /100 | #135 | Excellent 16.4% |
| Immigrants | Northern Africa | 87.5 /100 | #136 | Excellent 16.4% |
| Immigrants | Chile | 85.3 /100 | #137 | Excellent 16.4% |
| Germans | 84.8 /100 | #138 | Excellent 16.5% |
| Immigrants | Hungary | 84.5 /100 | #139 | Excellent 16.5% |
| Guamanians/Chamorros | 84.2 /100 | #140 | Excellent 16.5% |
| Immigrants | Western Europe | 83.3 /100 | #141 | Excellent 16.5% |
| Portuguese | 83.0 /100 | #142 | Excellent 16.5% |
| Samoans | 83.0 /100 | #143 | Excellent 16.5% |
| Ethiopians | 82.7 /100 | #144 | Excellent 16.5% |