Spaniard vs Immigrants from Germany Child Poverty Under the Age of 5
COMPARE
Spaniard
Immigrants from Germany
Child Poverty Under the Age of 5
Child Poverty Under the Age of 5 Comparison
Spaniards
Immigrants from Germany
18.1%
CHILD POVERTY UNDER THE AGE OF 5
12.8/ 100
METRIC RATING
205th/ 347
METRIC RANK
17.4%
CHILD POVERTY UNDER THE AGE OF 5
41.0/ 100
METRIC RATING
181st/ 347
METRIC RANK
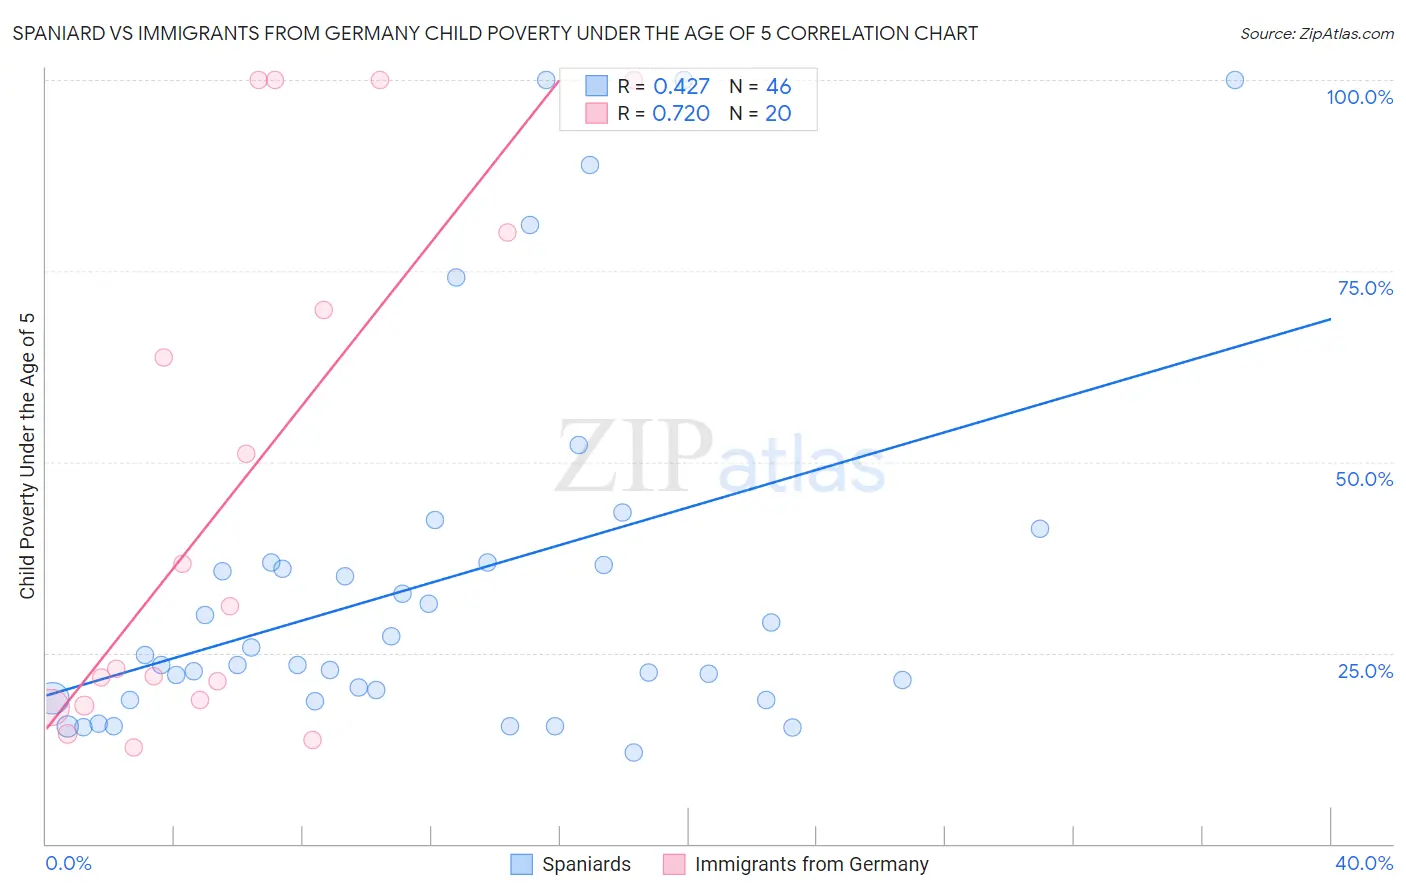
Spaniard vs Immigrants from Germany Child Poverty Under the Age of 5 Correlation Chart
The statistical analysis conducted on geographies consisting of 424,376,046 people shows a moderate positive correlation between the proportion of Spaniards and poverty level among children under the age of 5 in the United States with a correlation coefficient (R) of 0.427 and weighted average of 18.1%. Similarly, the statistical analysis conducted on geographies consisting of 440,983,234 people shows a strong positive correlation between the proportion of Immigrants from Germany and poverty level among children under the age of 5 in the United States with a correlation coefficient (R) of 0.720 and weighted average of 17.4%, a difference of 4.0%.
Child Poverty Under the Age of 5 Correlation Summary
| Measurement | Spaniard | Immigrants from Germany |
| Minimum | 11.9% | 12.7% |
| Maximum | 100.0% | 100.0% |
| Range | 88.1% | 87.3% |
| Mean | 34.4% | 45.8% |
| Median | 24.1% | 27.0% |
| Interquartile 25% (IQ1) | 19.0% | 18.5% |
| Interquartile 75% (IQ3) | 36.8% | 74.9% |
| Interquartile Range (IQR) | 17.7% | 56.4% |
| Standard Deviation (Sample) | 24.1% | 33.9% |
| Standard Deviation (Population) | 23.8% | 33.0% |
Similar Demographics by Child Poverty Under the Age of 5
Demographics Similar to Spaniards by Child Poverty Under the Age of 5
In terms of child poverty under the age of 5, the demographic groups most similar to Spaniards are White/Caucasian (18.1%, a difference of 0.060%), Immigrants from Eastern Africa (18.1%, a difference of 0.13%), Immigrants from Cambodia (18.1%, a difference of 0.19%), Japanese (18.1%, a difference of 0.21%), and Ugandan (18.0%, a difference of 0.22%).
| Demographics | Rating | Rank | Child Poverty Under the Age of 5 |
| Celtics | 18.3 /100 | #198 | Poor 17.9% |
| Hungarians | 18.3 /100 | #199 | Poor 17.9% |
| Iraqis | 14.0 /100 | #200 | Poor 18.0% |
| Ugandans | 13.9 /100 | #201 | Poor 18.0% |
| Japanese | 13.8 /100 | #202 | Poor 18.1% |
| Immigrants | Cambodia | 13.7 /100 | #203 | Poor 18.1% |
| Immigrants | Eastern Africa | 13.4 /100 | #204 | Poor 18.1% |
| Spaniards | 12.8 /100 | #205 | Poor 18.1% |
| Whites/Caucasians | 12.6 /100 | #206 | Poor 18.1% |
| Immigrants | Immigrants | 9.9 /100 | #207 | Tragic 18.2% |
| Scotch-Irish | 9.8 /100 | #208 | Tragic 18.2% |
| Spanish | 9.8 /100 | #209 | Tragic 18.2% |
| Panamanians | 9.7 /100 | #210 | Tragic 18.2% |
| Moroccans | 9.4 /100 | #211 | Tragic 18.2% |
| Nepalese | 8.7 /100 | #212 | Tragic 18.3% |
Demographics Similar to Immigrants from Germany by Child Poverty Under the Age of 5
In terms of child poverty under the age of 5, the demographic groups most similar to Immigrants from Germany are Arab (17.4%, a difference of 0.030%), Hawaiian (17.4%, a difference of 0.050%), South American Indian (17.4%, a difference of 0.050%), Lebanese (17.4%, a difference of 0.070%), and Immigrants from Cameroon (17.4%, a difference of 0.18%).
| Demographics | Rating | Rank | Child Poverty Under the Age of 5 |
| Immigrants | Saudi Arabia | 50.0 /100 | #174 | Average 17.2% |
| Immigrants | Lebanon | 47.6 /100 | #175 | Average 17.3% |
| Immigrants | Iraq | 45.2 /100 | #176 | Average 17.3% |
| Immigrants | Sierra Leone | 43.6 /100 | #177 | Average 17.3% |
| Immigrants | Cameroon | 42.7 /100 | #178 | Average 17.4% |
| Hawaiians | 41.5 /100 | #179 | Average 17.4% |
| South American Indians | 41.4 /100 | #180 | Average 17.4% |
| Immigrants | Germany | 41.0 /100 | #181 | Average 17.4% |
| Arabs | 40.7 /100 | #182 | Average 17.4% |
| Lebanese | 40.3 /100 | #183 | Average 17.4% |
| Immigrants | Costa Rica | 39.0 /100 | #184 | Fair 17.4% |
| Immigrants | Armenia | 38.0 /100 | #185 | Fair 17.5% |
| Immigrants | Bosnia and Herzegovina | 35.0 /100 | #186 | Fair 17.5% |
| Kenyans | 34.7 /100 | #187 | Fair 17.5% |
| Carpatho Rusyns | 33.6 /100 | #188 | Fair 17.5% |