Spaniard vs Dutch West Indian Child Poverty Under the Age of 5
COMPARE
Spaniard
Dutch West Indian
Child Poverty Under the Age of 5
Child Poverty Under the Age of 5 Comparison
Spaniards
Dutch West Indians
18.1%
CHILD POVERTY UNDER THE AGE OF 5
12.8/ 100
METRIC RATING
205th/ 347
METRIC RANK
23.3%
CHILD POVERTY UNDER THE AGE OF 5
0.0/ 100
METRIC RATING
318th/ 347
METRIC RANK
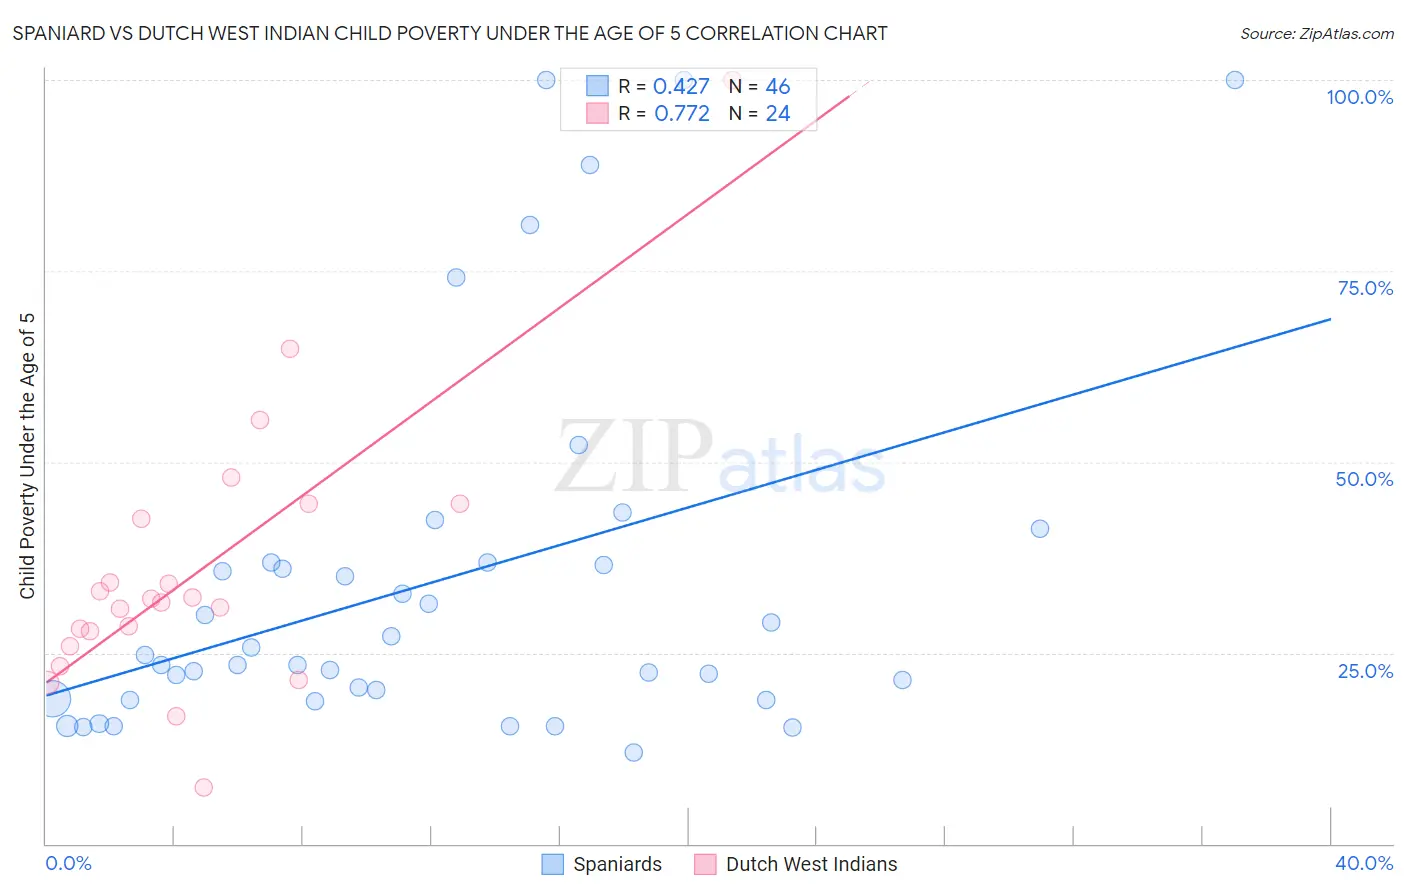
Spaniard vs Dutch West Indian Child Poverty Under the Age of 5 Correlation Chart
The statistical analysis conducted on geographies consisting of 424,376,046 people shows a moderate positive correlation between the proportion of Spaniards and poverty level among children under the age of 5 in the United States with a correlation coefficient (R) of 0.427 and weighted average of 18.1%. Similarly, the statistical analysis conducted on geographies consisting of 85,247,098 people shows a strong positive correlation between the proportion of Dutch West Indians and poverty level among children under the age of 5 in the United States with a correlation coefficient (R) of 0.772 and weighted average of 23.3%, a difference of 28.7%.
Child Poverty Under the Age of 5 Correlation Summary
| Measurement | Spaniard | Dutch West Indian |
| Minimum | 11.9% | 7.4% |
| Maximum | 100.0% | 100.0% |
| Range | 88.1% | 92.6% |
| Mean | 34.4% | 35.8% |
| Median | 24.1% | 31.8% |
| Interquartile 25% (IQ1) | 19.0% | 26.9% |
| Interquartile 75% (IQ3) | 36.8% | 43.5% |
| Interquartile Range (IQR) | 17.7% | 16.6% |
| Standard Deviation (Sample) | 24.1% | 18.5% |
| Standard Deviation (Population) | 23.8% | 18.1% |
Similar Demographics by Child Poverty Under the Age of 5
Demographics Similar to Spaniards by Child Poverty Under the Age of 5
In terms of child poverty under the age of 5, the demographic groups most similar to Spaniards are White/Caucasian (18.1%, a difference of 0.060%), Immigrants from Eastern Africa (18.1%, a difference of 0.13%), Immigrants from Cambodia (18.1%, a difference of 0.19%), Japanese (18.1%, a difference of 0.21%), and Ugandan (18.0%, a difference of 0.22%).
| Demographics | Rating | Rank | Child Poverty Under the Age of 5 |
| Celtics | 18.3 /100 | #198 | Poor 17.9% |
| Hungarians | 18.3 /100 | #199 | Poor 17.9% |
| Iraqis | 14.0 /100 | #200 | Poor 18.0% |
| Ugandans | 13.9 /100 | #201 | Poor 18.0% |
| Japanese | 13.8 /100 | #202 | Poor 18.1% |
| Immigrants | Cambodia | 13.7 /100 | #203 | Poor 18.1% |
| Immigrants | Eastern Africa | 13.4 /100 | #204 | Poor 18.1% |
| Spaniards | 12.8 /100 | #205 | Poor 18.1% |
| Whites/Caucasians | 12.6 /100 | #206 | Poor 18.1% |
| Immigrants | Immigrants | 9.9 /100 | #207 | Tragic 18.2% |
| Scotch-Irish | 9.8 /100 | #208 | Tragic 18.2% |
| Spanish | 9.8 /100 | #209 | Tragic 18.2% |
| Panamanians | 9.7 /100 | #210 | Tragic 18.2% |
| Moroccans | 9.4 /100 | #211 | Tragic 18.2% |
| Nepalese | 8.7 /100 | #212 | Tragic 18.3% |
Demographics Similar to Dutch West Indians by Child Poverty Under the Age of 5
In terms of child poverty under the age of 5, the demographic groups most similar to Dutch West Indians are Menominee (23.3%, a difference of 0.10%), Chippewa (23.4%, a difference of 0.48%), Yakama (23.1%, a difference of 0.60%), Arapaho (23.1%, a difference of 0.72%), and Choctaw (23.5%, a difference of 0.86%).
| Demographics | Rating | Rank | Child Poverty Under the Age of 5 |
| Seminole | 0.0 /100 | #311 | Tragic 22.8% |
| Hondurans | 0.0 /100 | #312 | Tragic 23.0% |
| Bahamians | 0.0 /100 | #313 | Tragic 23.0% |
| U.S. Virgin Islanders | 0.0 /100 | #314 | Tragic 23.0% |
| Arapaho | 0.0 /100 | #315 | Tragic 23.1% |
| Yakama | 0.0 /100 | #316 | Tragic 23.1% |
| Menominee | 0.0 /100 | #317 | Tragic 23.3% |
| Dutch West Indians | 0.0 /100 | #318 | Tragic 23.3% |
| Chippewa | 0.0 /100 | #319 | Tragic 23.4% |
| Choctaw | 0.0 /100 | #320 | Tragic 23.5% |
| Immigrants | Honduras | 0.0 /100 | #321 | Tragic 23.5% |
| Ute | 0.0 /100 | #322 | Tragic 23.5% |
| Pueblo | 0.0 /100 | #323 | Tragic 23.7% |
| Paiute | 0.0 /100 | #324 | Tragic 23.8% |
| Immigrants | Congo | 0.0 /100 | #325 | Tragic 23.9% |