Immigrants from Austria vs Immigrants from Chile Child Poverty Under the Age of 5
COMPARE
Immigrants from Austria
Immigrants from Chile
Child Poverty Under the Age of 5
Child Poverty Under the Age of 5 Comparison
Immigrants from Austria
Immigrants from Chile
16.0%
CHILD POVERTY UNDER THE AGE OF 5
93.5/ 100
METRIC RATING
116th/ 347
METRIC RANK
16.4%
CHILD POVERTY UNDER THE AGE OF 5
85.3/ 100
METRIC RATING
137th/ 347
METRIC RANK
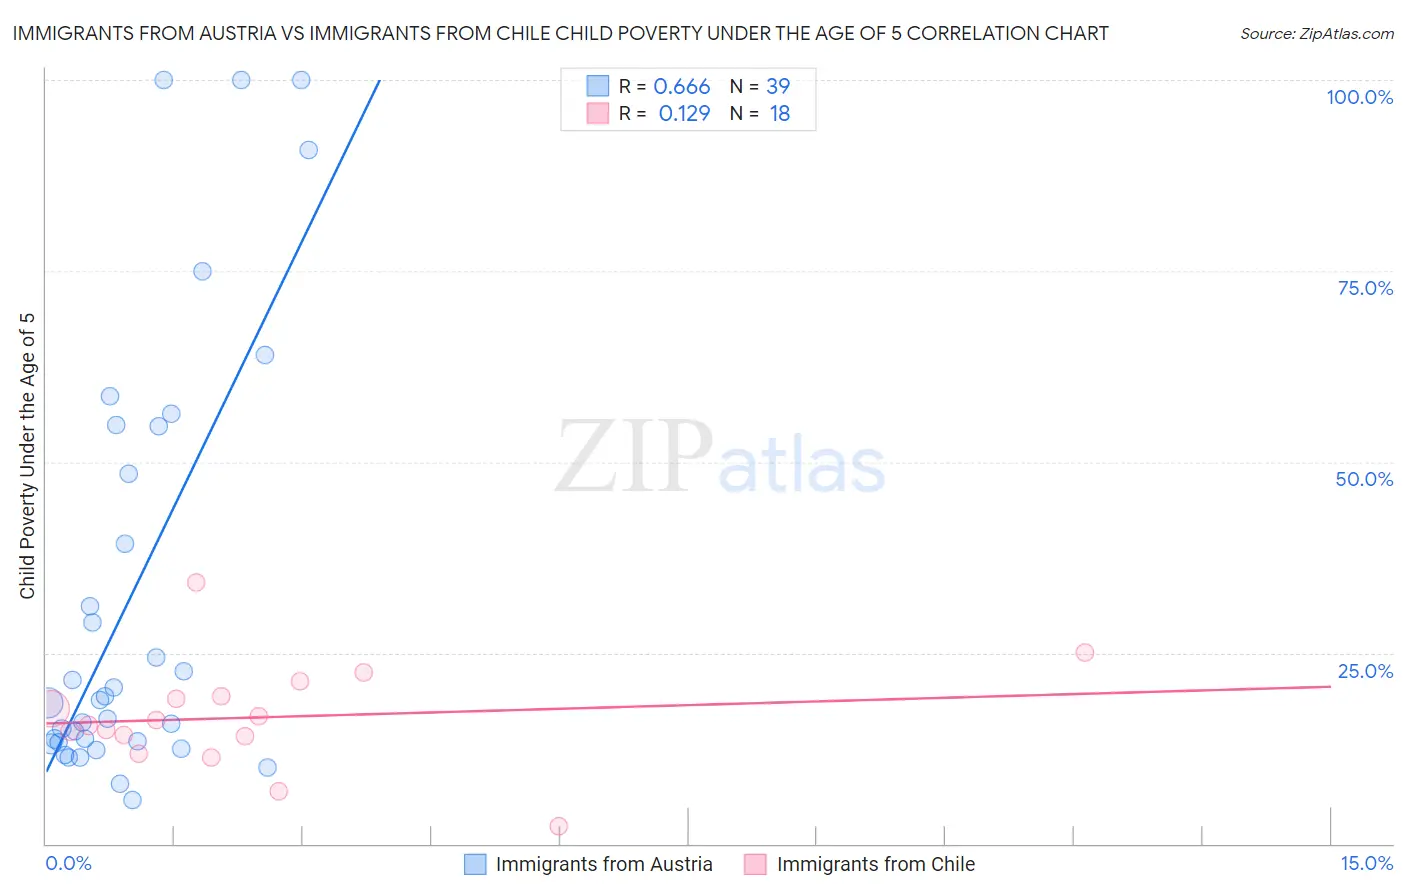
Immigrants from Austria vs Immigrants from Chile Child Poverty Under the Age of 5 Correlation Chart
The statistical analysis conducted on geographies consisting of 162,753,273 people shows a significant positive correlation between the proportion of Immigrants from Austria and poverty level among children under the age of 5 in the United States with a correlation coefficient (R) of 0.666 and weighted average of 16.0%. Similarly, the statistical analysis conducted on geographies consisting of 213,144,685 people shows a poor positive correlation between the proportion of Immigrants from Chile and poverty level among children under the age of 5 in the United States with a correlation coefficient (R) of 0.129 and weighted average of 16.4%, a difference of 2.5%.
Child Poverty Under the Age of 5 Correlation Summary
| Measurement | Immigrants from Austria | Immigrants from Chile |
| Minimum | 5.8% | 2.3% |
| Maximum | 100.0% | 34.3% |
| Range | 94.2% | 32.0% |
| Mean | 32.7% | 16.5% |
| Median | 18.8% | 15.9% |
| Interquartile 25% (IQ1) | 13.3% | 14.0% |
| Interquartile 75% (IQ3) | 54.7% | 19.4% |
| Interquartile Range (IQR) | 41.4% | 5.3% |
| Standard Deviation (Sample) | 28.4% | 7.0% |
| Standard Deviation (Population) | 28.0% | 6.8% |
Similar Demographics by Child Poverty Under the Age of 5
Demographics Similar to Immigrants from Austria by Child Poverty Under the Age of 5
In terms of child poverty under the age of 5, the demographic groups most similar to Immigrants from Austria are Basque (16.0%, a difference of 0.020%), Immigrants from Denmark (16.0%, a difference of 0.020%), Immigrants from Jordan (16.1%, a difference of 0.13%), Albanian (16.0%, a difference of 0.17%), and Immigrants from Kuwait (16.0%, a difference of 0.19%).
| Demographics | Rating | Rank | Child Poverty Under the Age of 5 |
| Northern Europeans | 94.3 /100 | #109 | Exceptional 16.0% |
| Romanians | 94.3 /100 | #110 | Exceptional 16.0% |
| Pakistanis | 94.2 /100 | #111 | Exceptional 16.0% |
| Peruvians | 94.1 /100 | #112 | Exceptional 16.0% |
| Puget Sound Salish | 94.1 /100 | #113 | Exceptional 16.0% |
| Immigrants | Kuwait | 93.9 /100 | #114 | Exceptional 16.0% |
| Albanians | 93.8 /100 | #115 | Exceptional 16.0% |
| Immigrants | Austria | 93.5 /100 | #116 | Exceptional 16.0% |
| Basques | 93.4 /100 | #117 | Exceptional 16.0% |
| Immigrants | Denmark | 93.4 /100 | #118 | Exceptional 16.0% |
| Immigrants | Jordan | 93.2 /100 | #119 | Exceptional 16.1% |
| Immigrants | Peru | 92.6 /100 | #120 | Exceptional 16.1% |
| Mongolians | 92.5 /100 | #121 | Exceptional 16.1% |
| Immigrants | Southern Europe | 92.0 /100 | #122 | Exceptional 16.1% |
| Austrians | 92.0 /100 | #123 | Exceptional 16.1% |
Demographics Similar to Immigrants from Chile by Child Poverty Under the Age of 5
In terms of child poverty under the age of 5, the demographic groups most similar to Immigrants from Chile are German (16.5%, a difference of 0.10%), Immigrants from Hungary (16.5%, a difference of 0.16%), Guamanian/Chamorro (16.5%, a difference of 0.23%), Immigrants from Western Europe (16.5%, a difference of 0.42%), and Portuguese (16.5%, a difference of 0.46%).
| Demographics | Rating | Rank | Child Poverty Under the Age of 5 |
| Immigrants | Norway | 89.3 /100 | #130 | Excellent 16.3% |
| Finns | 88.3 /100 | #131 | Excellent 16.3% |
| Serbians | 88.2 /100 | #132 | Excellent 16.3% |
| Icelanders | 87.9 /100 | #133 | Excellent 16.3% |
| Immigrants | North Macedonia | 87.8 /100 | #134 | Excellent 16.4% |
| Brazilians | 87.8 /100 | #135 | Excellent 16.4% |
| Immigrants | Northern Africa | 87.5 /100 | #136 | Excellent 16.4% |
| Immigrants | Chile | 85.3 /100 | #137 | Excellent 16.4% |
| Germans | 84.8 /100 | #138 | Excellent 16.5% |
| Immigrants | Hungary | 84.5 /100 | #139 | Excellent 16.5% |
| Guamanians/Chamorros | 84.2 /100 | #140 | Excellent 16.5% |
| Immigrants | Western Europe | 83.3 /100 | #141 | Excellent 16.5% |
| Portuguese | 83.0 /100 | #142 | Excellent 16.5% |
| Samoans | 83.0 /100 | #143 | Excellent 16.5% |
| Ethiopians | 82.7 /100 | #144 | Excellent 16.5% |