Immigrants from Canada vs Belizean Male Poverty
COMPARE
Immigrants from Canada
Belizean
Male Poverty
Male Poverty Comparison
Immigrants from Canada
Belizeans
10.2%
MALE POVERTY
97.1/ 100
METRIC RATING
72nd/ 347
METRIC RANK
13.6%
MALE POVERTY
0.0/ 100
METRIC RATING
278th/ 347
METRIC RANK
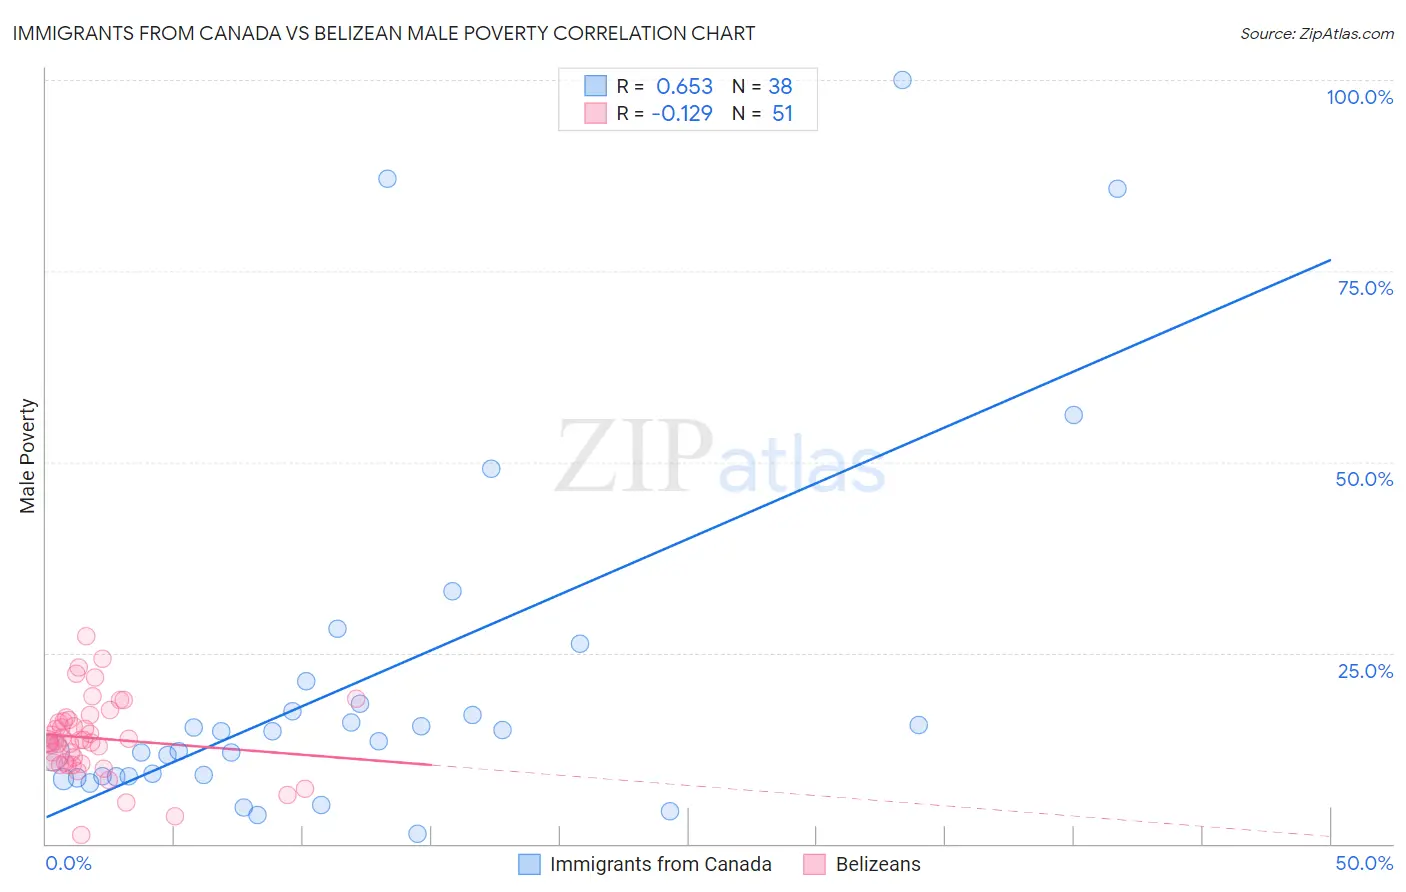
Immigrants from Canada vs Belizean Male Poverty Correlation Chart
The statistical analysis conducted on geographies consisting of 458,819,233 people shows a significant positive correlation between the proportion of Immigrants from Canada and poverty level among males in the United States with a correlation coefficient (R) of 0.653 and weighted average of 10.2%. Similarly, the statistical analysis conducted on geographies consisting of 144,147,961 people shows a poor negative correlation between the proportion of Belizeans and poverty level among males in the United States with a correlation coefficient (R) of -0.129 and weighted average of 13.6%, a difference of 33.4%.
Male Poverty Correlation Summary
| Measurement | Immigrants from Canada | Belizean |
| Minimum | 1.3% | 1.1% |
| Maximum | 100.0% | 27.1% |
| Range | 98.8% | 26.0% |
| Mean | 21.2% | 13.8% |
| Median | 14.1% | 13.5% |
| Interquartile 25% (IQ1) | 8.8% | 10.7% |
| Interquartile 75% (IQ3) | 18.3% | 16.2% |
| Interquartile Range (IQR) | 9.5% | 5.5% |
| Standard Deviation (Sample) | 23.5% | 5.0% |
| Standard Deviation (Population) | 23.2% | 4.9% |
Similar Demographics by Male Poverty
Demographics Similar to Immigrants from Canada by Male Poverty
In terms of male poverty, the demographic groups most similar to Immigrants from Canada are European (10.2%, a difference of 0.010%), Paraguayan (10.2%, a difference of 0.030%), Immigrants from Australia (10.2%, a difference of 0.050%), Immigrants from Asia (10.2%, a difference of 0.080%), and Immigrants from Eastern Europe (10.2%, a difference of 0.16%).
| Demographics | Rating | Rank | Male Poverty |
| Zimbabweans | 97.5 /100 | #65 | Exceptional 10.2% |
| Serbians | 97.5 /100 | #66 | Exceptional 10.2% |
| Immigrants | Netherlands | 97.3 /100 | #67 | Exceptional 10.2% |
| Immigrants | Sri Lanka | 97.2 /100 | #68 | Exceptional 10.2% |
| Immigrants | Australia | 97.1 /100 | #69 | Exceptional 10.2% |
| Paraguayans | 97.1 /100 | #70 | Exceptional 10.2% |
| Europeans | 97.1 /100 | #71 | Exceptional 10.2% |
| Immigrants | Canada | 97.1 /100 | #72 | Exceptional 10.2% |
| Immigrants | Asia | 97.0 /100 | #73 | Exceptional 10.2% |
| Immigrants | Eastern Europe | 96.9 /100 | #74 | Exceptional 10.2% |
| Carpatho Rusyns | 96.9 /100 | #75 | Exceptional 10.2% |
| Dutch | 96.9 /100 | #76 | Exceptional 10.2% |
| Immigrants | Belgium | 96.8 /100 | #77 | Exceptional 10.3% |
| Irish | 96.8 /100 | #78 | Exceptional 10.3% |
| Immigrants | North America | 96.5 /100 | #79 | Exceptional 10.3% |
Demographics Similar to Belizeans by Male Poverty
In terms of male poverty, the demographic groups most similar to Belizeans are Bangladeshi (13.6%, a difference of 0.10%), Haitian (13.7%, a difference of 0.18%), Immigrants from Latin America (13.6%, a difference of 0.24%), Mexican (13.7%, a difference of 0.27%), and Yaqui (13.7%, a difference of 0.32%).
| Demographics | Rating | Rank | Male Poverty |
| Spanish Americans | 0.0 /100 | #271 | Tragic 13.4% |
| Immigrants | Bahamas | 0.0 /100 | #272 | Tragic 13.5% |
| Chickasaw | 0.0 /100 | #273 | Tragic 13.5% |
| Immigrants | West Indies | 0.0 /100 | #274 | Tragic 13.5% |
| Barbadians | 0.0 /100 | #275 | Tragic 13.6% |
| Immigrants | Latin America | 0.0 /100 | #276 | Tragic 13.6% |
| Bangladeshis | 0.0 /100 | #277 | Tragic 13.6% |
| Belizeans | 0.0 /100 | #278 | Tragic 13.6% |
| Haitians | 0.0 /100 | #279 | Tragic 13.7% |
| Mexicans | 0.0 /100 | #280 | Tragic 13.7% |
| Yaqui | 0.0 /100 | #281 | Tragic 13.7% |
| Immigrants | Cabo Verde | 0.0 /100 | #282 | Tragic 13.7% |
| Comanche | 0.0 /100 | #283 | Tragic 13.8% |
| Immigrants | Haiti | 0.0 /100 | #284 | Tragic 13.8% |
| West Indians | 0.0 /100 | #285 | Tragic 13.8% |