Sudanese vs Belizean Male Poverty
COMPARE
Sudanese
Belizean
Male Poverty
Male Poverty Comparison
Sudanese
Belizeans
12.8%
MALE POVERTY
0.3/ 100
METRIC RATING
241st/ 347
METRIC RANK
13.6%
MALE POVERTY
0.0/ 100
METRIC RATING
278th/ 347
METRIC RANK
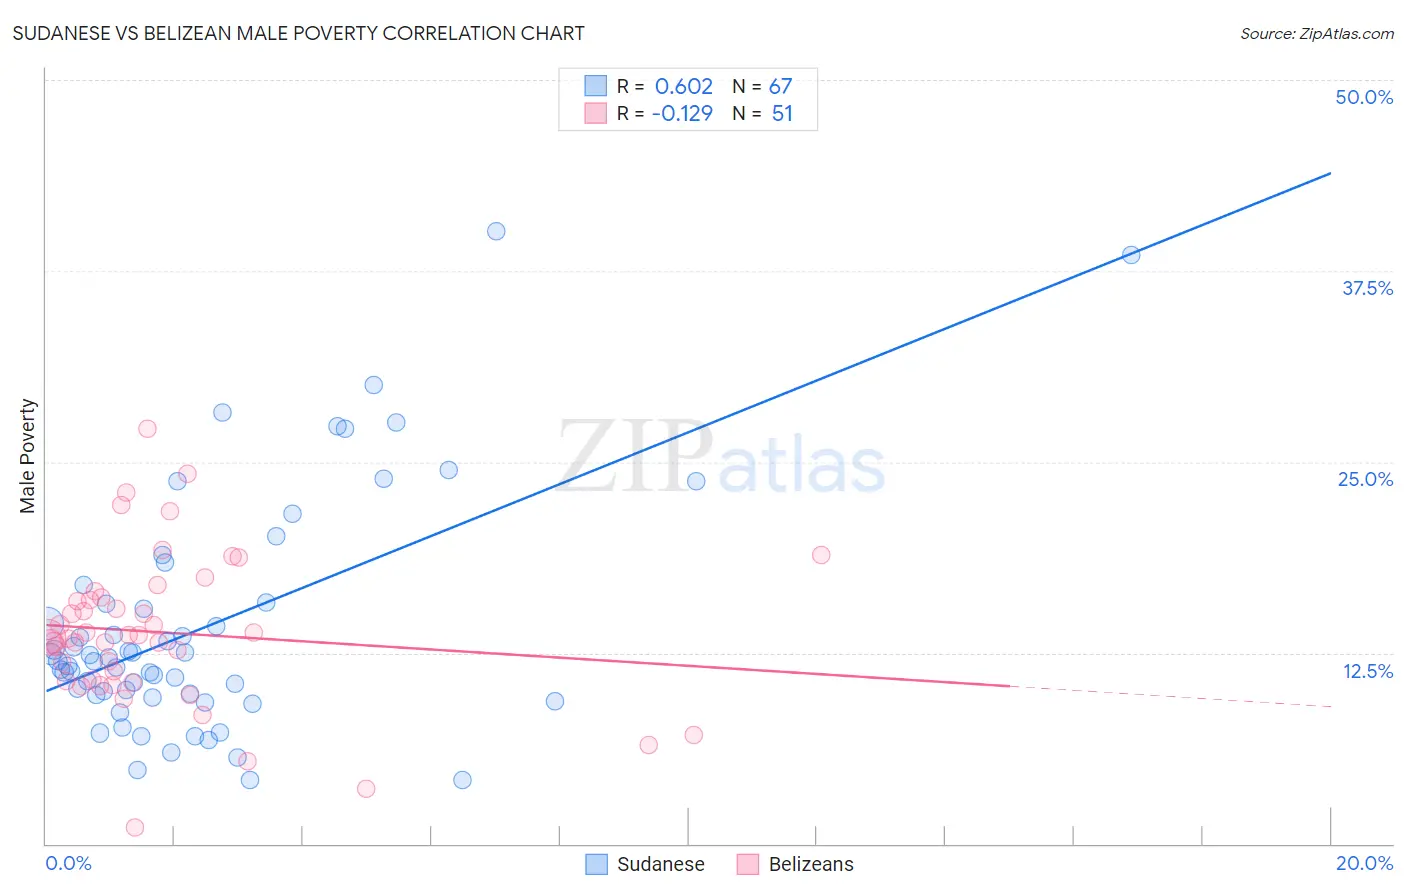
Sudanese vs Belizean Male Poverty Correlation Chart
The statistical analysis conducted on geographies consisting of 110,106,340 people shows a significant positive correlation between the proportion of Sudanese and poverty level among males in the United States with a correlation coefficient (R) of 0.602 and weighted average of 12.8%. Similarly, the statistical analysis conducted on geographies consisting of 144,147,961 people shows a poor negative correlation between the proportion of Belizeans and poverty level among males in the United States with a correlation coefficient (R) of -0.129 and weighted average of 13.6%, a difference of 6.9%.
Male Poverty Correlation Summary
| Measurement | Sudanese | Belizean |
| Minimum | 4.2% | 1.1% |
| Maximum | 40.1% | 27.1% |
| Range | 35.9% | 26.0% |
| Mean | 14.2% | 13.8% |
| Median | 12.0% | 13.5% |
| Interquartile 25% (IQ1) | 9.8% | 10.7% |
| Interquartile 75% (IQ3) | 15.8% | 16.2% |
| Interquartile Range (IQR) | 6.1% | 5.5% |
| Standard Deviation (Sample) | 7.6% | 5.0% |
| Standard Deviation (Population) | 7.6% | 4.9% |
Similar Demographics by Male Poverty
Demographics Similar to Sudanese by Male Poverty
In terms of male poverty, the demographic groups most similar to Sudanese are Nepalese (12.8%, a difference of 0.17%), Alaskan Athabascan (12.8%, a difference of 0.20%), Tsimshian (12.8%, a difference of 0.31%), Liberian (12.8%, a difference of 0.32%), and Immigrants from Middle Africa (12.7%, a difference of 0.36%).
| Demographics | Rating | Rank | Male Poverty |
| Immigrants | Armenia | 0.6 /100 | #234 | Tragic 12.6% |
| Immigrants | Laos | 0.5 /100 | #235 | Tragic 12.6% |
| Immigrants | Saudi Arabia | 0.4 /100 | #236 | Tragic 12.7% |
| French American Indians | 0.4 /100 | #237 | Tragic 12.7% |
| Ecuadorians | 0.4 /100 | #238 | Tragic 12.7% |
| Ghanaians | 0.4 /100 | #239 | Tragic 12.7% |
| Immigrants | Middle Africa | 0.4 /100 | #240 | Tragic 12.7% |
| Sudanese | 0.3 /100 | #241 | Tragic 12.8% |
| Nepalese | 0.3 /100 | #242 | Tragic 12.8% |
| Alaskan Athabascans | 0.3 /100 | #243 | Tragic 12.8% |
| Tsimshian | 0.3 /100 | #244 | Tragic 12.8% |
| Liberians | 0.3 /100 | #245 | Tragic 12.8% |
| Immigrants | El Salvador | 0.2 /100 | #246 | Tragic 12.8% |
| Immigrants | Western Africa | 0.2 /100 | #247 | Tragic 12.9% |
| Immigrants | Sudan | 0.2 /100 | #248 | Tragic 12.9% |
Demographics Similar to Belizeans by Male Poverty
In terms of male poverty, the demographic groups most similar to Belizeans are Bangladeshi (13.6%, a difference of 0.10%), Haitian (13.7%, a difference of 0.18%), Immigrants from Latin America (13.6%, a difference of 0.24%), Mexican (13.7%, a difference of 0.27%), and Yaqui (13.7%, a difference of 0.32%).
| Demographics | Rating | Rank | Male Poverty |
| Spanish Americans | 0.0 /100 | #271 | Tragic 13.4% |
| Immigrants | Bahamas | 0.0 /100 | #272 | Tragic 13.5% |
| Chickasaw | 0.0 /100 | #273 | Tragic 13.5% |
| Immigrants | West Indies | 0.0 /100 | #274 | Tragic 13.5% |
| Barbadians | 0.0 /100 | #275 | Tragic 13.6% |
| Immigrants | Latin America | 0.0 /100 | #276 | Tragic 13.6% |
| Bangladeshis | 0.0 /100 | #277 | Tragic 13.6% |
| Belizeans | 0.0 /100 | #278 | Tragic 13.6% |
| Haitians | 0.0 /100 | #279 | Tragic 13.7% |
| Mexicans | 0.0 /100 | #280 | Tragic 13.7% |
| Yaqui | 0.0 /100 | #281 | Tragic 13.7% |
| Immigrants | Cabo Verde | 0.0 /100 | #282 | Tragic 13.7% |
| Comanche | 0.0 /100 | #283 | Tragic 13.8% |
| Immigrants | Haiti | 0.0 /100 | #284 | Tragic 13.8% |
| West Indians | 0.0 /100 | #285 | Tragic 13.8% |