Immigrants from Europe vs Sierra Leonean Male Poverty
COMPARE
Immigrants from Europe
Sierra Leonean
Male Poverty
Male Poverty Comparison
Immigrants from Europe
Sierra Leoneans
10.1%
MALE POVERTY
97.9/ 100
METRIC RATING
59th/ 347
METRIC RANK
11.4%
MALE POVERTY
29.9/ 100
METRIC RATING
188th/ 347
METRIC RANK
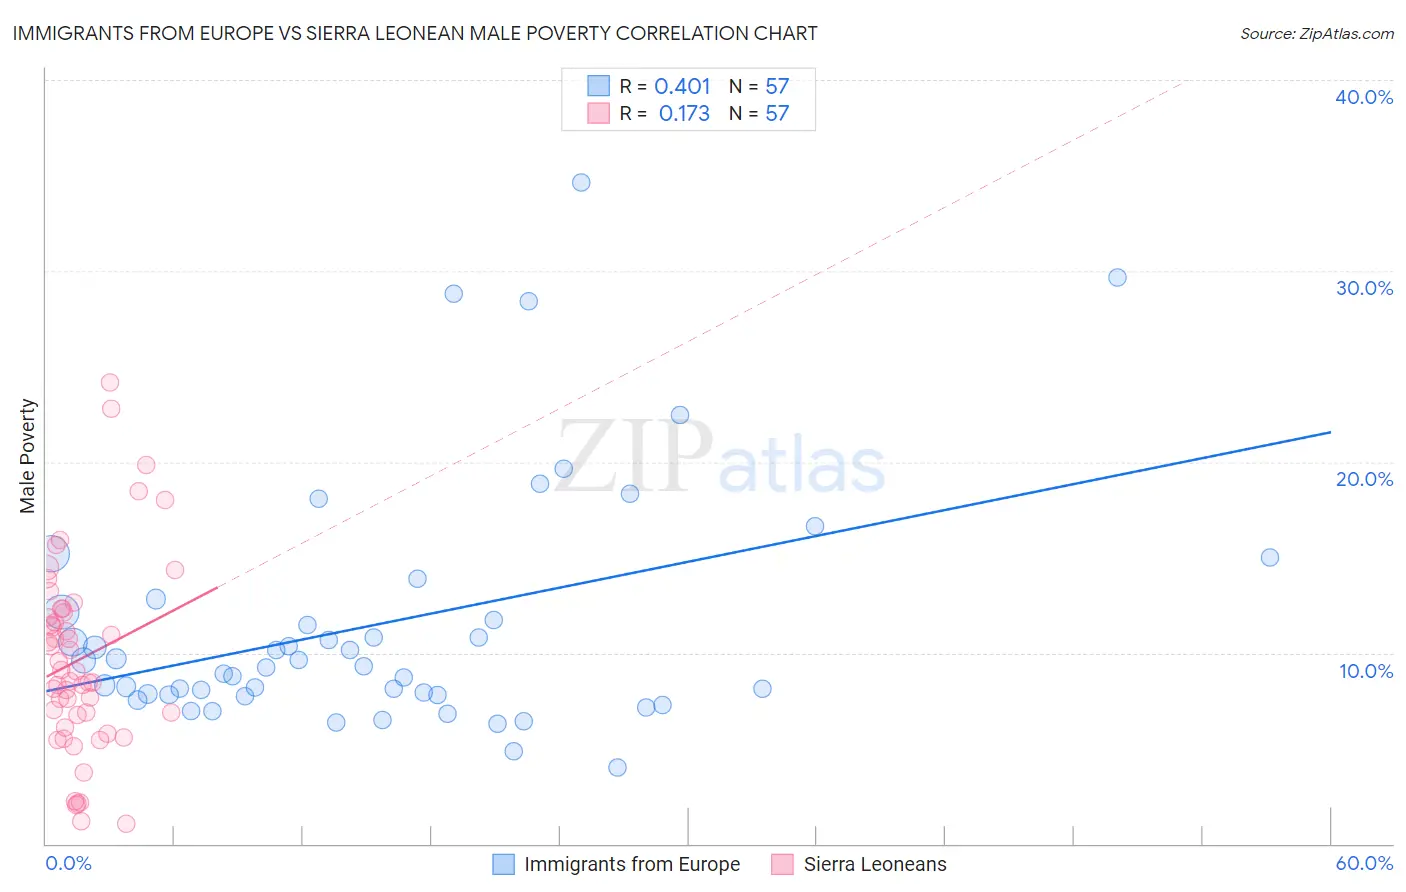
Immigrants from Europe vs Sierra Leonean Male Poverty Correlation Chart
The statistical analysis conducted on geographies consisting of 546,187,630 people shows a moderate positive correlation between the proportion of Immigrants from Europe and poverty level among males in the United States with a correlation coefficient (R) of 0.401 and weighted average of 10.1%. Similarly, the statistical analysis conducted on geographies consisting of 83,343,100 people shows a poor positive correlation between the proportion of Sierra Leoneans and poverty level among males in the United States with a correlation coefficient (R) of 0.173 and weighted average of 11.4%, a difference of 12.7%.
Male Poverty Correlation Summary
| Measurement | Immigrants from Europe | Sierra Leonean |
| Minimum | 4.0% | 1.0% |
| Maximum | 34.6% | 24.2% |
| Range | 30.6% | 23.1% |
| Mean | 11.6% | 9.7% |
| Median | 9.3% | 9.0% |
| Interquartile 25% (IQ1) | 7.8% | 6.4% |
| Interquartile 75% (IQ3) | 12.5% | 12.2% |
| Interquartile Range (IQR) | 4.7% | 5.8% |
| Standard Deviation (Sample) | 6.5% | 5.0% |
| Standard Deviation (Population) | 6.4% | 5.0% |
Similar Demographics by Male Poverty
Demographics Similar to Immigrants from Europe by Male Poverty
In terms of male poverty, the demographic groups most similar to Immigrants from Europe are Ukrainian (10.1%, a difference of 0.090%), Austrian (10.1%, a difference of 0.11%), Scandinavian (10.1%, a difference of 0.13%), Immigrants from Italy (10.2%, a difference of 0.20%), and Estonian (10.1%, a difference of 0.21%).
| Demographics | Rating | Rank | Male Poverty |
| Asians | 98.7 /100 | #52 | Exceptional 10.0% |
| Immigrants | Czechoslovakia | 98.6 /100 | #53 | Exceptional 10.0% |
| Immigrants | Austria | 98.5 /100 | #54 | Exceptional 10.0% |
| Germans | 98.3 /100 | #55 | Exceptional 10.1% |
| Immigrants | Bulgaria | 98.2 /100 | #56 | Exceptional 10.1% |
| Estonians | 98.1 /100 | #57 | Exceptional 10.1% |
| Scandinavians | 98.0 /100 | #58 | Exceptional 10.1% |
| Immigrants | Europe | 97.9 /100 | #59 | Exceptional 10.1% |
| Ukrainians | 97.9 /100 | #60 | Exceptional 10.1% |
| Austrians | 97.8 /100 | #61 | Exceptional 10.1% |
| Immigrants | Italy | 97.8 /100 | #62 | Exceptional 10.2% |
| Slovaks | 97.7 /100 | #63 | Exceptional 10.2% |
| Swiss | 97.5 /100 | #64 | Exceptional 10.2% |
| Zimbabweans | 97.5 /100 | #65 | Exceptional 10.2% |
| Serbians | 97.5 /100 | #66 | Exceptional 10.2% |
Demographics Similar to Sierra Leoneans by Male Poverty
In terms of male poverty, the demographic groups most similar to Sierra Leoneans are Hawaiian (11.4%, a difference of 0.18%), Immigrants from Iraq (11.4%, a difference of 0.22%), Immigrants from Sierra Leone (11.4%, a difference of 0.33%), Immigrants from Afghanistan (11.4%, a difference of 0.38%), and Israeli (11.5%, a difference of 0.45%).
| Demographics | Rating | Rank | Male Poverty |
| Immigrants | Costa Rica | 39.5 /100 | #181 | Fair 11.3% |
| Mongolians | 39.0 /100 | #182 | Fair 11.3% |
| Kenyans | 38.4 /100 | #183 | Fair 11.3% |
| Immigrants | South America | 36.9 /100 | #184 | Fair 11.3% |
| Immigrants | Afghanistan | 33.3 /100 | #185 | Fair 11.4% |
| Immigrants | Sierra Leone | 32.9 /100 | #186 | Fair 11.4% |
| Immigrants | Iraq | 31.9 /100 | #187 | Fair 11.4% |
| Sierra Leoneans | 29.9 /100 | #188 | Fair 11.4% |
| Hawaiians | 28.3 /100 | #189 | Fair 11.4% |
| Israelis | 26.1 /100 | #190 | Fair 11.5% |
| South American Indians | 22.8 /100 | #191 | Fair 11.5% |
| Immigrants | Uruguay | 19.1 /100 | #192 | Poor 11.6% |
| Immigrants | Kuwait | 17.3 /100 | #193 | Poor 11.6% |
| Immigrants | Kenya | 16.1 /100 | #194 | Poor 11.6% |
| Arabs | 15.8 /100 | #195 | Poor 11.6% |