South African vs Sierra Leonean Male Poverty
COMPARE
South African
Sierra Leonean
Male Poverty
Male Poverty Comparison
South Africans
Sierra Leoneans
10.7%
MALE POVERTY
86.8/ 100
METRIC RATING
123rd/ 347
METRIC RANK
11.4%
MALE POVERTY
29.9/ 100
METRIC RATING
188th/ 347
METRIC RANK
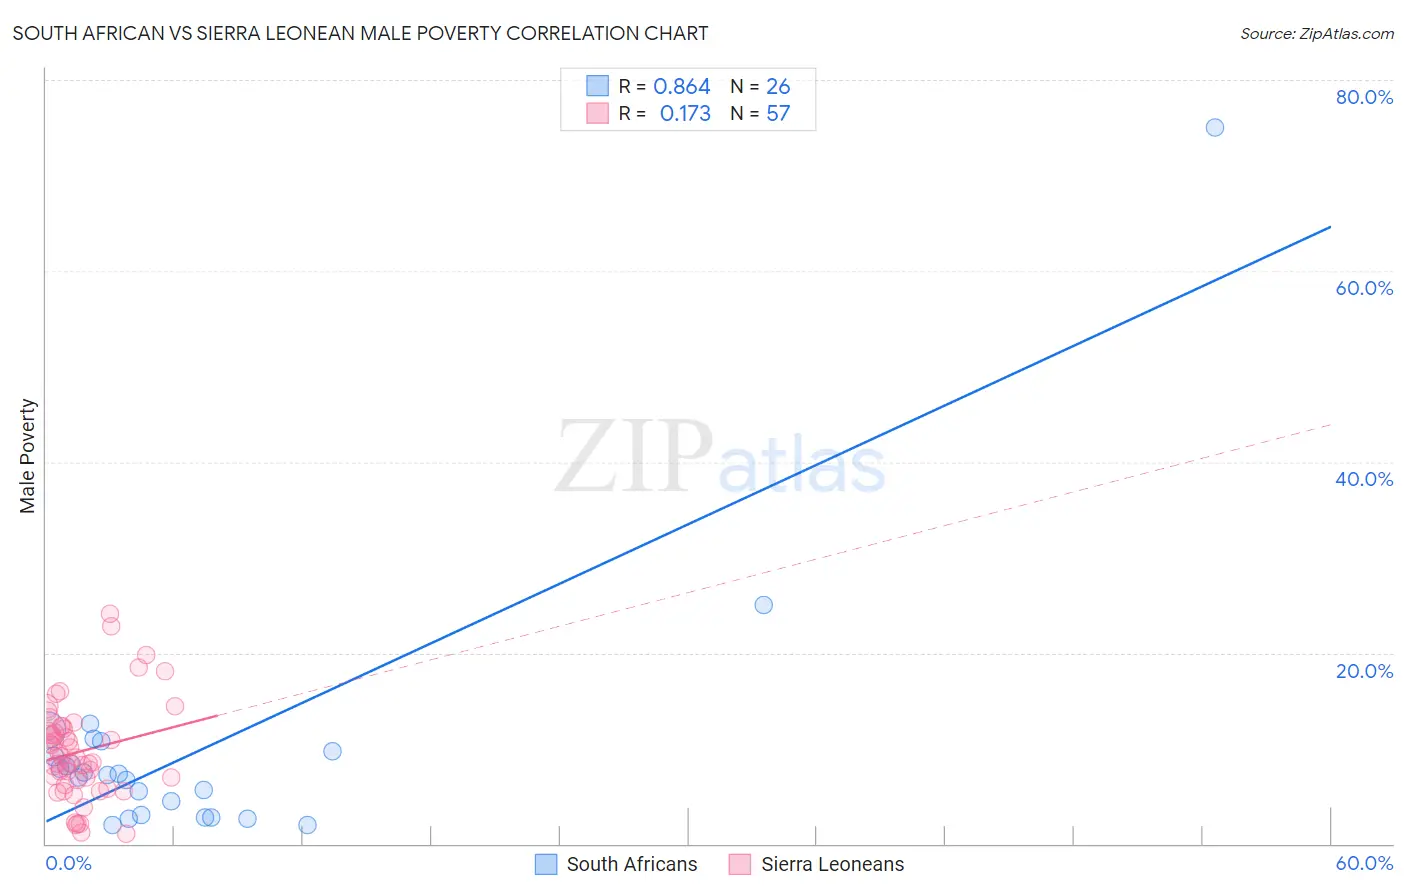
South African vs Sierra Leonean Male Poverty Correlation Chart
The statistical analysis conducted on geographies consisting of 182,517,352 people shows a very strong positive correlation between the proportion of South Africans and poverty level among males in the United States with a correlation coefficient (R) of 0.864 and weighted average of 10.7%. Similarly, the statistical analysis conducted on geographies consisting of 83,343,100 people shows a poor positive correlation between the proportion of Sierra Leoneans and poverty level among males in the United States with a correlation coefficient (R) of 0.173 and weighted average of 11.4%, a difference of 7.0%.
Male Poverty Correlation Summary
| Measurement | South African | Sierra Leonean |
| Minimum | 2.0% | 1.0% |
| Maximum | 75.0% | 24.2% |
| Range | 73.0% | 23.1% |
| Mean | 9.9% | 9.7% |
| Median | 7.2% | 9.0% |
| Interquartile 25% (IQ1) | 3.0% | 6.4% |
| Interquartile 75% (IQ3) | 9.7% | 12.2% |
| Interquartile Range (IQR) | 6.6% | 5.8% |
| Standard Deviation (Sample) | 14.1% | 5.0% |
| Standard Deviation (Population) | 13.8% | 5.0% |
Similar Demographics by Male Poverty
Demographics Similar to South Africans by Male Poverty
In terms of male poverty, the demographic groups most similar to South Africans are French (10.7%, a difference of 0.030%), Native Hawaiian (10.7%, a difference of 0.040%), Peruvian (10.7%, a difference of 0.060%), Immigrants from China (10.7%, a difference of 0.070%), and Immigrants from Hungary (10.7%, a difference of 0.17%).
| Demographics | Rating | Rank | Male Poverty |
| Sri Lankans | 88.1 /100 | #116 | Excellent 10.6% |
| Immigrants | South Eastern Asia | 88.1 /100 | #117 | Excellent 10.6% |
| Okinawans | 87.6 /100 | #118 | Excellent 10.7% |
| Immigrants | Hungary | 87.6 /100 | #119 | Excellent 10.7% |
| Immigrants | China | 87.1 /100 | #120 | Excellent 10.7% |
| Peruvians | 87.1 /100 | #121 | Excellent 10.7% |
| Native Hawaiians | 87.0 /100 | #122 | Excellent 10.7% |
| South Africans | 86.8 /100 | #123 | Excellent 10.7% |
| French | 86.7 /100 | #124 | Excellent 10.7% |
| Immigrants | Norway | 86.0 /100 | #125 | Excellent 10.7% |
| Immigrants | Ukraine | 84.3 /100 | #126 | Excellent 10.7% |
| Puget Sound Salish | 84.3 /100 | #127 | Excellent 10.7% |
| Immigrants | Western Europe | 84.2 /100 | #128 | Excellent 10.7% |
| Immigrants | Peru | 84.1 /100 | #129 | Excellent 10.7% |
| Chileans | 83.9 /100 | #130 | Excellent 10.7% |
Demographics Similar to Sierra Leoneans by Male Poverty
In terms of male poverty, the demographic groups most similar to Sierra Leoneans are Hawaiian (11.4%, a difference of 0.18%), Immigrants from Iraq (11.4%, a difference of 0.22%), Immigrants from Sierra Leone (11.4%, a difference of 0.33%), Immigrants from Afghanistan (11.4%, a difference of 0.38%), and Israeli (11.5%, a difference of 0.45%).
| Demographics | Rating | Rank | Male Poverty |
| Immigrants | Costa Rica | 39.5 /100 | #181 | Fair 11.3% |
| Mongolians | 39.0 /100 | #182 | Fair 11.3% |
| Kenyans | 38.4 /100 | #183 | Fair 11.3% |
| Immigrants | South America | 36.9 /100 | #184 | Fair 11.3% |
| Immigrants | Afghanistan | 33.3 /100 | #185 | Fair 11.4% |
| Immigrants | Sierra Leone | 32.9 /100 | #186 | Fair 11.4% |
| Immigrants | Iraq | 31.9 /100 | #187 | Fair 11.4% |
| Sierra Leoneans | 29.9 /100 | #188 | Fair 11.4% |
| Hawaiians | 28.3 /100 | #189 | Fair 11.4% |
| Israelis | 26.1 /100 | #190 | Fair 11.5% |
| South American Indians | 22.8 /100 | #191 | Fair 11.5% |
| Immigrants | Uruguay | 19.1 /100 | #192 | Poor 11.6% |
| Immigrants | Kuwait | 17.3 /100 | #193 | Poor 11.6% |
| Immigrants | Kenya | 16.1 /100 | #194 | Poor 11.6% |
| Arabs | 15.8 /100 | #195 | Poor 11.6% |